Demos - MATLAB
 1. Introduction
 2. Sinusoids

 |
Sinusoids |
This is an introduction to plotting sinusoids (both sine
and cosine waves) from equations.
In addition, the tutorial reviews how to write the
equation given a plot of the sinusoid.
|
 |
Rotating Phasors |
Here are four movies showing rotating phasors and
how the real part of the phasor traces out a sinusoid
versus time.
Two of the movies show how rotating phasors of
different frequencies interact to produce complicated
waveforms such as beat signals.
|
 |
Sine Drill |
Sine Drill (sindrill) is a program that tests the users ability to determine
basic parameters of a sinusoid.
After a plot of a sinusoid is displayed, the user must correctly
guess its amplitude, frequency, and phase.
|
 |
Tuning Fork |
This demo shows how the size and stiffness of
a tuning fork affect the tone produced by
three different tuning forks.
|
 |
Clay Whistle |
Here's a demo that shows the nearly sinusoidal waveforms
produced by two clay whistles.
|
 |
ZDrill |
ZDrill is a program that tests the users ability to calculate the result
of simple operations on complex numbers.
The program emphasizes the vectorial view of a complex number.
The following six operations are supported:
- Add
- Subtract
- Multiply
- Divide
- Inverse
- Conjugate
|
 3. Spectrum Representation
 |
FM Synthesis |
This demo gives the mathematical derivation
of how instrument sounds can be
synthesized using the principles of frequency modulation.
The example sounds include a bell and a clarinet.
|
 |
Rotating Phasors |
Here are four movies showing rotating phasors and
how the real part of the phasor traces out a sinusoid
versus time.
Two of the movies show how rotating phasors of
different frequencies interact to produce complicated
waveforms such as beat signals.
|
 |
Fourier Series |
This MATLAB demo reconstructs a square, triangle, or
sawtooth waveform, using a given number of Fourier Series coefficients.
|
 |
Spectrograms |
This demo illustrates the connection between a variety of
sounds and their spectrograms. Among the different
sounds are simple tones and waveforms, real and synthesized music,
and chirp signals.
|
 |
Vowel Synthesis |
This demonstrates the idea of harmonic sinusoids.
Five sinusoids with a common fundamental frequency are
added together, one at a time.
|
 4. Sampling and Aliasing
The collection of demos in Chapter 5 are designed to illustrate the
concepts of sampling, aliasing and reconstruction.
 |
Aliasing and Folding |
Here are some movies that illustrate the concepts of
aliasing and folding when a sinusoid is sampled
below the Nyquist rate.
|
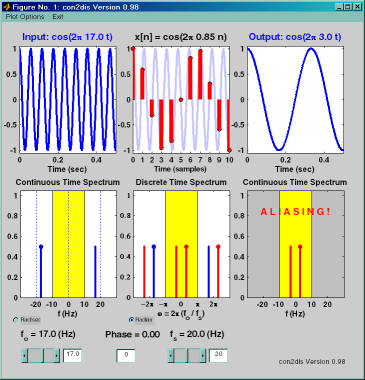 |
Continuous-Discrete Sampling |
The Continuous-Discrete Sampling Demo (con2dis)
is a program that shows the continuous
and discrete spectra (and signals) during sampling.
Features:
- Users can change the input frequency and sampling rate.
- Frequency axis can be labeled in hertz or radians/sec.
- Reconstruction through D/A is also shown.
|
 |
Reconstruction Movies |
Here are some movies that illustrate the reconstruction process
|
 |
Sampling Theory Tutorial |
These movies explain the basics of sampling rates and sampling periods.
They also explain how to use Matlab to simulate a sinusoid of a given frequency and duration.
|
 |
Strobe Movies |
These movies give an alternate view of the sampling process
by using the strobing nature of a camcorder (30 frames per
second) to show aliasing of a pattern on a rotating disk.
|
 |
Synthetic Strobe Movies |
These movies were generated in MATLAB to show the strobe/sampling
effect on a rotating disk. With MATLAB the rotation rate can be
calibrated exactly, so that forward and backward movement of the
spokes on the disk (due to aliasing) can be tracked.
|
 5. FIR Filters
The Chapter 6 demos consist of block diagram examples designed to
reinforce the ideas of linearity and time-invariance in FIR filtering.
 |
Discrete Convolution Demo |
The Discrete Convolution Demo (dconvdemo) is a program that
helps visualize the process of discrete-time convolution.
Features:
- Users can choose from a variety of different signals.
- Signals can be dragged around with the mouse with results displayed in real-time.
- Tutorial mode lets students hide convolution result until requested.
- Various plot options enable the tool to be effectively used as a lecture aid in a classroom environment.
|
 6. Frequency Response of FIR Filters
This collection of demos illustrates the effects of LTI filters on various
types of signals.
In the first demo the linearity of FIR filters is demonstrated by cascading
filters and showing that the order of the cascade has no effect on the final
output.
The second demo explores the effects of low-pass filtering on signals.
You will have an opportunity to listen to a composite chirp and speech signal
before and after filtering.
 |
Cascading FIR Filters |
LTI FIR filters are used to process images, thus demonstrating
that low-pass filtering is blurring, while high-pass filtering
will sharpen edges.
|
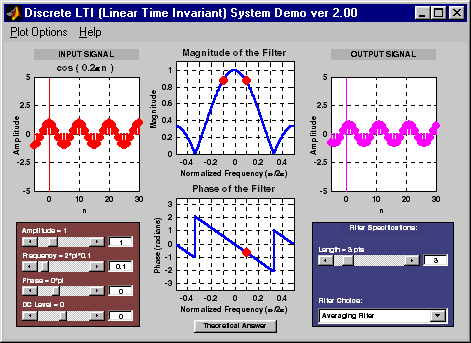 |
DLTI Demo |
DLTIDemo is a program that illustrates the relationship between the input
and output of a discrete-time linear time-invariant (LTI) filter
when the input is a sinusoidal function.
The user is allowed to control the parameters of both the input sinusoid and the digital filter.
|
 |
Introduction to FIR Filtering |
A brief introduction to FIR filters and how they
can change the sound of speech signals.
|
 7. Z-Transform
 |
Three Domains - FIR |
The connection between the Z-transform domain of poles and zeros
and the time domain, and also the frequency domain is illustrated
with several movies where individual zeros or zero pairs are moved
continuously.
|
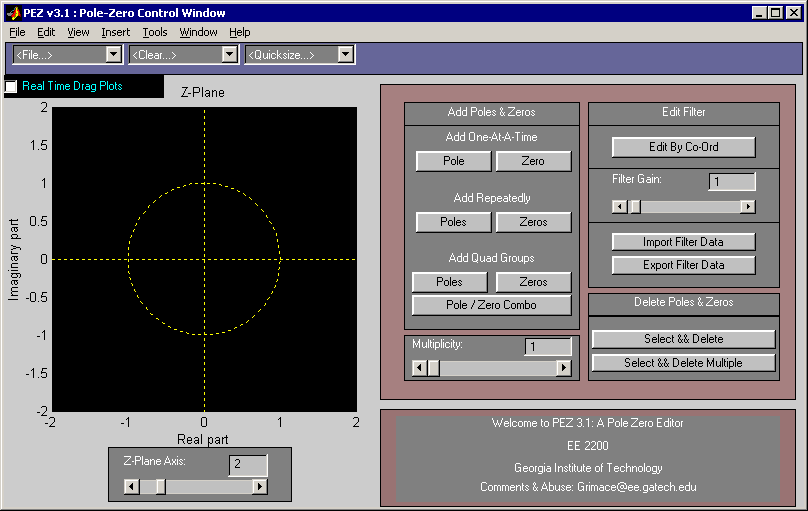 |
PeZ GUI |
PeZ (pezdemo) is a MATLAB tool for pole/zero manipulation.
Poles and zeros can be placed anywhere on a map of the
z-plane.
The corresponding time domain (n) and frequency
domain (ω) plots will be displayed.
When a zero pair (or pole pair) is dragged, the
impulse response and frequency response plots will
be updated in real time.
|
 |
PeZ Tutorial |
These movies describe how to use the PeZ graphical user interface
to place/move poles and zeros.
They also show how to display the associated impulse and frequency response.
|
 |
Z to Freq |
A demo that illustrates the connection between the complex
Z-plane and the frequency response of a system. The frequency
response is obtained by evaluating H(z) on the unit circle
in the complex Z-plane.
|
 8. IIR Filters
 |
Three Domains - IIR |
The connection between the z-transform domain of poles and zeros
and the time domain, and also the frequency domain is illustrated
with several movies where individual poles, or zeros or pole pairs
of IIR filters are moved continuously.
|
 |
PeZ GUI |
PeZ (pezdemo) is a MATLAB tool for pole/zero manipulation.
Poles and zeros can be placed anywhere on a map of the
z-plane.
The corresponding time domain (n) and frequency
domain (ω) plots will be displayed.
When a zero pair (or pole pair) is dragged, the
impulse response and frequency response plots will
be updated in real time.
|
 |
PeZ Tutorial |
These movies describe how to use the PeZ graphical user interface
to place/move poles and zeros.
They also show how to display the associated impulse and frequency response.
|
 |
IIR Filtering |
A short tutorial on first- and second-order IIR
(infinite-length impulse response) filters.
This demo shows plots in the three domains
for a variety of IIR filters
with different filter coefficients.
|
 |
Z to Freq |
A demo that illustrates the connection between the complex
Z-plane and the frequency response of a system. The frequency
response is obtained by evaluating H(z) on the unit circle
in the complex Z-plane.
|
 9. Continuous-Time Signals and LTI Systems
 |
Continuous Convolution Demo |
The Continuous Convolution Demo (cconvdemo) is a program that helps
visualize the
process of continuous-time convolution.
Features:
- Users can choose from a variety of different signals.
- Signals can be dragged around with the mouse with results
displayed in real-time.
- Tutorial mode lets students hide convolution result until requested.
- Various plot options enable the tool to be effectively used as a lecture
aid in a classroom environment.
|
 |
Discrete Convolution Demo |
The Discrete Convolution Demo (dconvdemo) is a program that
helps visualize the process of discrete-time convolution.
Features:
- Users can choose from a variety of different signals.
- Signals can be dragged around with the mouse with results displayed in real-time.
- Tutorial mode lets students hide convolution result until requested.
- Various plot options enable the tool to be effectively used as a lecture aid in a classroom environment.
|
 10. Frequency Response
 |
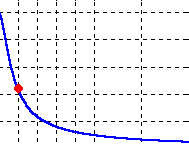
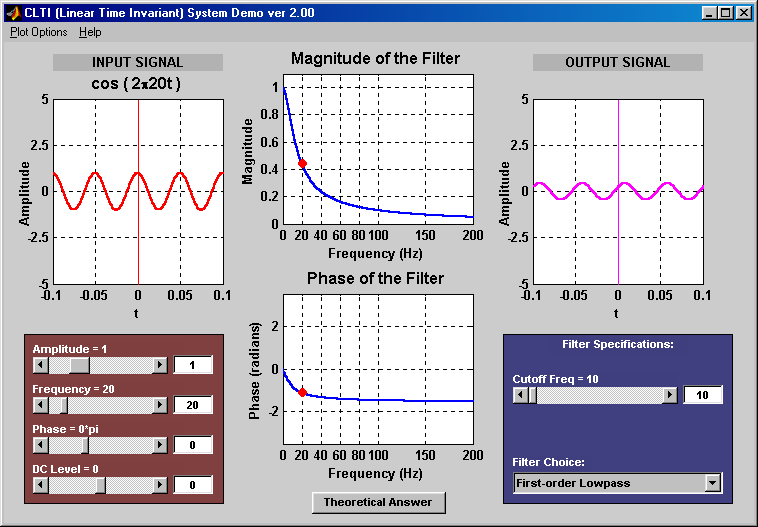
CLTI Demo |
CLTIDemo is a program that illustrates the relationship between the input
and output of a continous-time linear time-invariant (LTI) filter
when the input is a sinusoidal function.
The user is allowed to control the parameters of both the
input sinusoid and the filter.
|
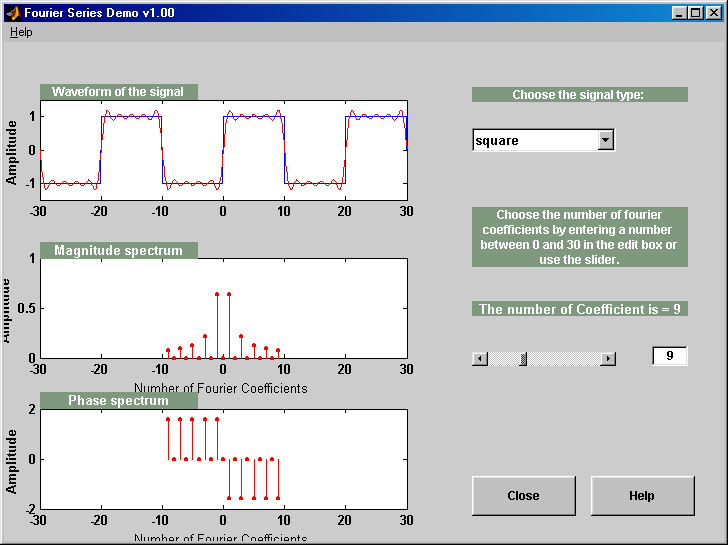 |
Fourier Series |
This MATLAB demo reconstructs a square, triangle, or
sawtooth waveform, using a given number of Fourier Series coefficients.
|
 11. Continuous-Time Fourier Transform
 |
CLTI Demo |
CLTIDemo is a program that illustrates the relationship between the input
and output of a continous-time linear time-invariant (LTI) filter
when the input is a sinusoidal function.
The user is allowed to control the parameters of both the
input sinusoid and the filter.
|
 |
Fourier Series |
This MATLAB demo reconstructs a square, triangle, or
sawtooth waveform, using a given number of Fourier Series coefficients.
|
 12. Filtering, Modulation, and Sampling
 |
CLTI Demo |
CLTIDemo is a program that illustrates the relationship between the input
and output of a continous-time linear time-invariant (LTI) filter
when the input is a sinusoidal function.
The user is allowed to control the parameters of both the
input sinusoid and the filter.
|
 |
Fourier Series |
This MATLAB demo reconstructs a square, triangle, or
sawtooth waveform, using a given number of Fourier Series coefficients.
|
 13. Computing the Spectrum
 |
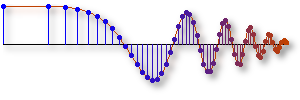
Wideband FM Signals |
Four FM signals are presented via sound and spectrogram.
Each signal chirps faster than the one before it.
|
 |
Music GUI |
A MATLAB graphical user interface for composing music, listening
to sinusoidal synthesis and viewing the spectrogram of the song.
|
 |
Resolution of the Spectrogram |
These movies illustrate the inherent trade-offs between
time and frequency resolution of the spectrogram when
it is computed by a sliding-window FFT.
|
 A. Complex Numbers
 |
Complex Numbers via Matlab |
Examples of how complex numbers and complex exponentials
can be handled by MATLAB.
|
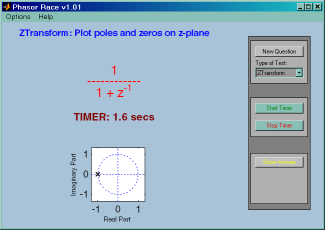 |
PhasorRaces |
PhasorRaces began as a speed drill for testing complex addition.
Now it includes many other related operations that can be tested
in a "drill" scenario: adding sinusoids, z-transforms, etc.
A timer starts as soon as the problem is posed, so that a
student can try to solve questions quickly and accurately.
|
 |
ZDrill |
ZDrill is a program that tests the users ability to calculate the result
of simple operations on complex numbers.
The program emphasizes the vectorial view of a complex number.
The following six operations are supported:
- Add
- Subtract
- Multiply
- Divide
- Inverse
- Conjugate
|