 (1)
(1) | Table of Contents |
Crummett and Western, Physics: Models and Applications,
Sec. 18.3
Halliday, Resnick, and Walker, Fundamentals of Physics (5th
ed.), Sec. 19-11
Tipler, Physics for Scientists and Engineers (3rd ed.), Sec.
16-3, 35-1
The tungsten filament of an incandescent bulb operates at a high temperature (around 2700 K) in vacuum. Under such circumstances, we expect radiation to be the predominant mechanism of heat transfer. In this experiment, you'll check this expectation by determining the relationship between the temperature of the glowing filament and the power delivered to it.
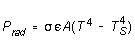
Radiated power depends on temperature according to the Stefan-Boltzmann equation
(1)
where ![]() is a
universal constant, A the surface area of the filament,
is a
universal constant, A the surface area of the filament, ![]() its emissivity, and T its absolute temperature. TS
is the temperature of the surroundings -- in this case, the glass envelope
of the bulb. At operating temperature, T 4 >> TS4
and the second term can be neglected. Thus if radiation is the only
mode of heat dissipation, and if
its emissivity, and T its absolute temperature. TS
is the temperature of the surroundings -- in this case, the glass envelope
of the bulb. At operating temperature, T 4 >> TS4
and the second term can be neglected. Thus if radiation is the only
mode of heat dissipation, and if ![]() is temperature-independent, then the input power should vary as the fourth
power of the filament temperature. Let us write
is temperature-independent, then the input power should vary as the fourth
power of the filament temperature. Let us write
![]() (2)
(2)
where n is an "unknown" exponent, to be determined experimentally. (If radiation is the only mode of heat loss, then the argument above says that n should equal 4.)
The resistance of the filament can be used as a measure of its temperature. In the temperature range of interest to us, the resistivity of tungsten varies with temperature very nearly as T1.20, that is, as T6/5. Therefore,
![]()
![]()
where V is the voltage across the filament, and I the current through it. But, using (2),
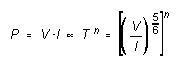
from which
![]() (3)
(3)
The point of the exercise is to measure the relation between the potential difference across the light-bulb filament and the current through it; from this, to determine the exponent n in Eq. (2); and from the value of n, draw a conclusion whether or not power is lost from the filament entirely, or predominantly, by radiation.
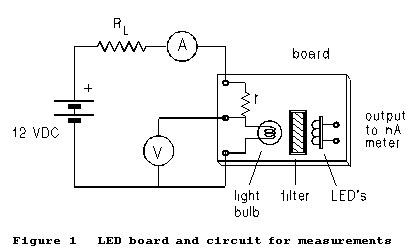 (1) Set
up the circuit of Figure 1. Only the two meters shown are required. A third
meter can be used to read the photocurrent from an LED looking at the glowing
filament. The current from the LED is an independent measure of the emitted
power. If this third meter is used, it should be a 4½-digit
digital multimeter, preferably a Data Precision M/2480. Set it on a DC
voltage scale; its input resistance is
(1) Set
up the circuit of Figure 1. Only the two meters shown are required. A third
meter can be used to read the photocurrent from an LED looking at the glowing
filament. The current from the LED is an independent measure of the emitted
power. If this third meter is used, it should be a 4½-digit
digital multimeter, preferably a Data Precision M/2480. Set it on a DC
voltage scale; its input resistance is ![]() ,
so that a 1 mV reading on the meter corresponds to a current of
10-10 A from the LED.
,
so that a 1 mV reading on the meter corresponds to a current of
10-10 A from the LED.
(2) Of the two meters shown in Figure 1, use whichever appears to you to be the more precise for the ammeter. RL is a decade resistance box used as a variable current control; r is a current-limiting resistor mounted on the light-bulb board itself. The physical layout of the light bulb, filter, and LED detector board is as suggested by Figure 1.
(3) Load resistor RL is your current control.
Set it to ![]() and
turn on the power supply. The current in the circuit will be of the order
of 100 mA, and the bulb should be glowing feebly, if at all. Decrease RL
until the voltmeter reads 4.5 V, and note its value. (The bulb should be
getting much brighter now.) Further decrease RL until
the voltmeter reads 6.0-6.1 V (or until the resistance box is zeroed),
and note its value. These two values define the range in which you will
make measurements. The current values in this operating range should be
around 200-250 mA.
and
turn on the power supply. The current in the circuit will be of the order
of 100 mA, and the bulb should be glowing feebly, if at all. Decrease RL
until the voltmeter reads 4.5 V, and note its value. (The bulb should be
getting much brighter now.) Further decrease RL until
the voltmeter reads 6.0-6.1 V (or until the resistance box is zeroed),
and note its value. These two values define the range in which you will
make measurements. The current values in this operating range should be
around 200-250 mA.
(4) Set RL at the top of the range you established in part (3). Record the bulb voltage, bulb current, and LED photocurrent. Repeat this for a total of 8-12 different settings in the range.
(5) Take another set of readings, exactly as in part (5), using a second light-bulb board.
(1) For each data set, draw a graph of ln(I) vs. Ln(I). According to Equation (3), it should be a straight line of slope k. Apply whatever statistical and graphical methods you need to determine (a) whether the data do in fact give you a straight-line graph, and (b) the value of k and its experimental error. This experiment gives you an opportunity to do some careful data massaging; be creative!
(2) In each case, use Equation (3) to determine a value for n. n is really the result of your experiment. By a critical evaluation of the data and procedures you've used to obtain n, estimate the uncertainty in your value of n.
(3) If the assumptions made in the paragraph following Eq. (1) are correct, the true value of n should be 4.00. Does your experimental value differ significantly from this? If radiation were not the only significant mode of heat transfer, how would this effect the value of n you would observe? Are there other reasons you might measure a n different from 4.00? Draw whatever conclusions you think are warranted from your data.
Chapter 6 -- Other Experiments -- The Photoelectric Effect
last update 6/96