 (1)
(1) | Table of Contents |
Crummett and Western, Physics: Models and Applications,
Sec. 38-3; 40-3,4
Halliday, Resnick, and Walker, Fundamentals of Physics (5th
ed.), Sec. 37-8, 40-6
(Tipler, Physics for Scientists and Engineers (3rd ed.),
Sec. 33-11, 35-5
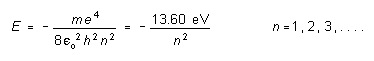
According to the Bohr theory of the hydrogen atom, the electron in such an atom is only allowed orbits about the nucleus that would give it an energy (kinetic plus potential) which is one of the following energies:
(1)
where m = the electron mass and e = the electron charge. The orbits and energy levels may be represented as shown in the diagram below.
If the electron should drop from the "second excited" state of motion (n=3) to the "first excited" state (n=2), for example, it would lose an amount of energy equal to E3 - E2. The lost energy is carried off in the form of a photon of energy Ep = E3 - E2 = hf where f is the frequency as the electromagnetic wave associated with the photon. Thus, the frequency of the emitted radiation would be
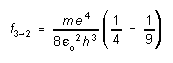 (2)
(2)
or in general for an electron transition from any energy level n = n I to any lower energy level n = nf
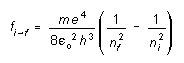 (3)
(3)
If we define the "Rydberg constant" R by
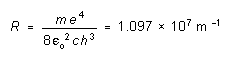 (4)
(4)
then we can rewrite the expression for the frequencies emitted by hydrogen in the form
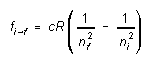 (5)
(5)
Hydrogen gas is excited by applying a high voltage to a tube containing
the gas. The atomic electrons are continually being excited into higher
energy orbits and then dropping back down to lower energy levels, emitting
radiation in the process. The frequencies of the visible spectrum
(Balmer series, nf = 2) are analyzed using a diffraction grating
spectrometer. The angle ![]() at which a given wavelength is observed is (see your 'Waves' textbook),
at which a given wavelength is observed is (see your 'Waves' textbook),
 (6)
(6)
where m = 1, 2, 3, . . . is the order of the diffraction peak and d the spacing between adjacent rulings on the grating.
 (1)
Set up first using the mercury source; you will use the known mercury
spectrum to calibrate your diffraction grating. Adjust the grating
orientation until it is as nearly perpendicular to the incident light beam
as possible. Take a prominent line such as the bright green line and adjust
the grating so that the first order positions of the green line occur at
equal angles right and left of the "straight ahead" image
of the slit.
(1)
Set up first using the mercury source; you will use the known mercury
spectrum to calibrate your diffraction grating. Adjust the grating
orientation until it is as nearly perpendicular to the incident light beam
as possible. Take a prominent line such as the bright green line and adjust
the grating so that the first order positions of the green line occur at
equal angles right and left of the "straight ahead" image
of the slit.
(2) Measure the spectrometer angle readings A at which you find the first order mercury lines on both sides of the zero order image. Arrange the data in a table as shown below. From these results calculate the most probable value of -- and uncertainty in -- the spacing d between adjacent rulings on the grating.
NOTE: The spectrometer is a precision instrument, and this entire experiment MUST BE CARRIED OUT AS PRECISELY AS POSSIBLE. For example, the angle scale of the spectrometer can be read to 1' of arc or better.
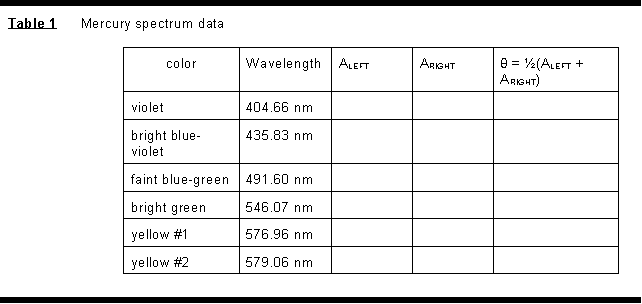
(3) Similarly measure the angles right and left at which you find the first and second order hydrogen spectrum lines. Determine the wavelengths (and uncertainties) present in this spectrum and compare with the theoretical values (equation 5). Identify the electron transitions (energy levels involved) which give rise to the spectral lines seen, and determine the energy differences between these levels using your experimental data. Finally, compute a value of the Rydberg constant from your data, with uncertainty, and compare with the theoretical value.
Chapter 6 -- Other Experiments -- X-Ray Fluorescence and the Compton Effect
last rev 3/96