 (1)
(1) | Table of Contents |
Crummett and Western, Physics: Models and Applications,
Sec. 40-1
Halliday, Resnick, and Walker, Fundamentals of Physics (5th
ed.), Sec. 39-4
Tipler, Physics for Scientists and Engineers (3rd edition),
Sec. 37-7
X-ray fluorescence: When a material is bombarded with X-rays, there are several things that may happen. If the incident photons have enough energy, they may knock an electron out of one of the inner shells (e.g. the innermost or "K" shell) of an atom of the material. When this happens an outer electron will drop into the vacancy in the inner shell, emitting its extra energy in the form of an X-ray photon. X-rays of particular energies characteristic of the target material are produced in this way. This process is called X-ray fluorescence; it can often be used to identify the elements present in the target material.
The Compton Effect: Another process which is always present is Compton scattering. An incident X-ray photon that collides with an electron in the target material scatters from it, transferring some of its initial energy to the electron. The scattered photon is thus at a lower energy -- that is, the scattered radiation has longer wavelength. If the electron is one of the outer, loosely bound, electrons of its target atom, it behaves as if it were free; the change in wavelength of the scattered radiation is then found to be
 (1)
(1)
In this equation, ![]() and El refer to the incident X-rays, and
and El refer to the incident X-rays, and ![]() and E2 to the scattered X-rays.
and E2 to the scattered X-rays. ![]() is the angle through which the X-rays have been scattered -- that is, the
angle between the directions of the incoming and outgoing photons.
is the angle through which the X-rays have been scattered -- that is, the
angle between the directions of the incoming and outgoing photons.
This describes scattering by a free electron. If, on the other hand, an X-ray photon scatters from one of the inner, more tightly bound electrons of the target atom, it can be considered to be scattered by the entire atom. In this case, there is very little change in the energy and wavelength of the photons. (Replace me, in Equation (1), with the mass of a whole atom.) This is sometimes spoken of as "hard Compton" scattering, as opposed to the "soft" Compton scattering described by Equation (1).
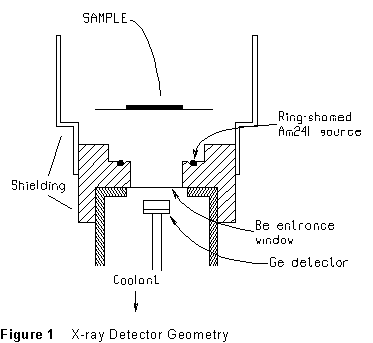 The source of the
X-rays (actually low-energy gamma rays) is a sample of radioactive americium
(241Am). It emits photons at energies 59.57 keV (by far the
strongest), 17.74 keV, 13.95 keV, 20.78 keV, and 26.36 keV. The detector
is a small piece of extremely pure germanium which is operated at low temperature.
(The source-sample-detector geometry is shown in Figure 1.)
| WARNING: Be extremely careful of this piece of equipment. It is fragile (both mechanically and electrically), and very expensive. The radiation source which it contains (in the copper-colored housing) would be very dangerous if the shielding were disturbed. The instructor will already have the equipment properly set up for you when you come to lab. |
The size of the electrical pulse produced by such a detector is proportional to the energy of the photon that strikes it. Thus if you connect the detector to a circuit that sorts out the pulses according to size, you have an X-ray spectrometer. This sorting is performed by a multichannel pulse height analyzer (MCA). For each incoming detector pulse, the MCA puts a count into one of its 2048 memory bins or "channels." The number of the channel it selects is proportional to the pulse height, and therefore to the photon's energy.
The MCA that we will be using here is a PCA-II 2048-channel analyzer built into a 286LP PC. It has 2048 channels, so that 2048 energy bins are available. The key point to remember is that the number of the energy bin, or "channel," in which a count appears is directly proportional to the pulse height.
Suppose the MCA is set up so that "full scale" (channel 2048) corresponds to about 8.0 V pulse height. Then channel 620 might store all incoming pulses between 2.48 and 2.484 V, channel 621 all pulses between 2.484 and 2.488 V, and so on and so on. The pulse height range of each channel is constant across all 2048 channels, so that, in this example, channel 800 would count pulses with height between 3.20 and 3.204 V, channel 1409 would count pulses between 5.636 and 5.640 keV, etc., etc.
The energy corresponding to a given pulse height is determined by the pulse amplifier gain; thus channel 0 need not correspond to zero pulse height, although it did in this example.
Figure 2 (below) shows the pulse height spectrum of 241Am X-rays scattered from a sliver of lead. The graph presents the collected data as a string of 2048 dots, as shown in the figure, spread evenly in the horizontal direction. The vertical position of each dot is proportional to the number of pulses registered in that channel.
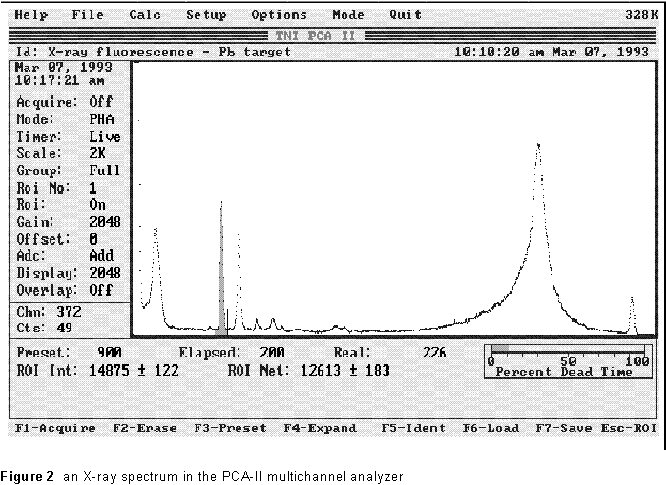
One channel is selected by a movable 'cursor'. In the figure, this is the vertical line just to the right of the shaded peak (just above the 'ed' in 'Elapsed'). The channel number to which the cursor is set, and the number of counts in that channel, are displayed directly at the lower left of the MCA display: here, 49 counts in channel 372. You can move the cursor to any desired spot on the pulse height spectrum display and read off the channel number, as well as the count in that channel.
Peaks -- narrow ranges of pulse height in which lots of
counts occur -- are usually of special interest to us. Such a peak corresponds
to a particular energy at which many photons are detected. For each target
element there is a characteristic set of these or X-ray 'lines', and the
table of Characteristic X-ray Emission Energies (included in these notes)
gives a list of the stronger ones. For example, the two strong peaks in
the region of channels 340-440 in the figure (the lower one is shaded)
are the ![]() and
and ![]() lines of lead.
lines of lead.
In this experiment, we will use the Compton scattering and fluorescence spectrum of a lead target (what is shown in Figure 2) to calibrate the analyzer -- that is, to assign an energy value to each channel number. This done, the energy value for each peak can be read directly from the analyzer screen.
Second, we will examine the X-rays Compton-scattered from a low-Z material like aluminum or plastic. The fluorescence energies from such materials are too low to register with this detector, so that what we see will show energies characteristic of Compton scattering only. From the calibration just established, we will be able to find the energies of the Compton-scattered X-rays. Finally, we use the calibrated analyzer to identify an unknown by measuring the energies of its characteristic X-rays produced by X-ray fluorescence.
When it is finished, call up the vertical-scale menu bar again and set the vertical scale to a linear value such that all the important peaks are on-screen and visible. A spectrum looking like that of Figure 2 should appear. The smaller, narrow peak to the right of the broad maximum is the "hard" Compton scattering of 59.57-keV X-rays from the source; it should be there, but be near the right-hand edge of the display. If its not, change the amplifier gain a little and repeat the procedure above, until it is. There are now four strong, well-defined peaks in the spectrum:
The fluorescence lines are the two strong peaks near channels 300-450 in the spectrum of Figure 2.
You will use two of these peaks to calibrate the analyzer --
that is, establish the relation between analyzer channel number and energy.
Press [Alt-C] to drop down the Calculate menu, and select [Calibrate].
Specify "keV" for the energy units. Move the cursor to the Pb
![]() peak and enter
its energy. Next move the cursor to the 59.57 keV "hard" Compton
peak and enter its energy. An extra [Enter] at the end finishes the procedure
and establishes the calibration. You will notice that the cursor position
on the screen is now directly in keV, rather than channel number.
peak and enter
its energy. Next move the cursor to the 59.57 keV "hard" Compton
peak and enter its energy. An extra [Enter] at the end finishes the procedure
and establishes the calibration. You will notice that the cursor position
on the screen is now directly in keV, rather than channel number.
Move the cursor to the Pb ![]() peak, read off its energy, and compare this to the value in the table at
the end of this document. There should be agreement between the analyzer
and the energy you find in the table. If not, check your calibration again.
peak, read off its energy, and compare this to the value in the table at
the end of this document. There should be agreement between the analyzer
and the energy you find in the table. If not, check your calibration again.
Clear the calibration spectrum by pressing [F2], and remove the sliver of lead from the target position.
In materials containing only low-Z elements, the fluorescence lines are at too low an energy for us to see, and the X-rays we detect will be all due to Compton scattering. Using some such target, accumulate a spectrum of scattered photons for 1 or 2 minutes. Examine your spectrum on the display scope. It will contain hard-scattering and soft-scattering lines corresponding to each of the photon energies from the source. The dominant feature you see will be a large, broad peak due to soft Compton scattering of the 59.57-keV radiation. The corresponding hard scattering line will be substantially higher in energy, and much narrower.
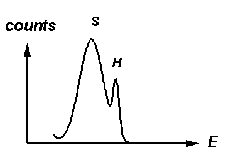 The hard- and
soft-scattering peaks corresponding to the lower-energy photons from the
source will look something like the sketch at right. There will be four
such groups in the 10-30 keV range. (The hard-scattering lines may be very
weak.) When you are sure that you have them all identified, record the
energies of the five hard-scattering and the five soft-scattering peaks.
Using the soft Compton scattering energy corresponding to the 59.57-keV
photons in Equation (1), use Equation (1) to determine scattering angle
![]() . Estimate the
uncertainty in your determination. Does your result appear consistent with
the drawing in Figure 1?
. Estimate the
uncertainty in your determination. Does your result appear consistent with
the drawing in Figure 1?
Using the value of ![]() thus determined, calculate expected values of the soft Compton-scattering
energy for each of the other four lines, and compare them to your measured
values. Do the energies you measured for the hard Compton scattering agree
with the incoming photon energy values, as one would expect from the discussion
on page 1?
thus determined, calculate expected values of the soft Compton-scattering
energy for each of the other four lines, and compare them to your measured
values. Do the energies you measured for the hard Compton scattering agree
with the incoming photon energy values, as one would expect from the discussion
on page 1?
Your instructor will give you an unknown material to analyze. Accumulate data on this material, and record the energies at which photon peaks occur. Using the calibration graph, try to identify all these peaks (except for those that you have already found to be Compton scattering peaks) with the fluorescence lines of one or a few elements. How precisely do you think you have determined the important energies?
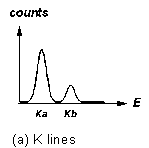
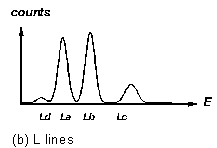
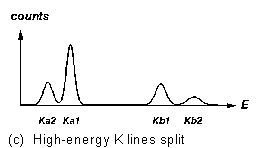
Figure 3 "Fingerprints" of some X-ray fluorescence lines
Fluorescence lines come in characteristic patterns. The highest energy
lines for an element are the "K" lines: these are a strong ![]() line followed by a several-times-weaker
line followed by a several-times-weaker ![]() line at a somewhat higher energy (Figure 3a). In a higher-Z element, where
the K lines are at higher energy, each of these lines is split in two (Figure
3c). The "L" lines, at lower energy in heavy elements, come in
a group like the one shown in figure 3b (can you recognize this pattern
in the lower half of the spectrum in Fig.2?). Characteristic X-ray energies
are given in a table at the end of this document.
line at a somewhat higher energy (Figure 3a). In a higher-Z element, where
the K lines are at higher energy, each of these lines is split in two (Figure
3c). The "L" lines, at lower energy in heavy elements, come in
a group like the one shown in figure 3b (can you recognize this pattern
in the lower half of the spectrum in Fig.2?). Characteristic X-ray energies
are given in a table at the end of this document.
Try to identify the elements that give rise to the fluorescence peaks you see. You would start by trying to identify the strongest peaks with K X-rays (refer to Figure 3). Don't forget to check the L lines of the heavy elements to see if they fit, too. Remember that, if one of the patterns of Figure 3 is present in the spectrum, the whole pattern must be present (although some lines may be too weak to be seen, or obscured by other stronger lines).
For low-Z materials, the only transitions that produce photons in X-ray energy range are those to electron vacancies in the K (n = 1) electron "shell."

For elements with higher atomic number, the K fluorescence lines split, and the L lines (resulting from vacancies in the second major electron shell of the atom) are detectable. See Figures 3 for the characteristic intensity patterns with which these lines appear.
| Z | element |
|
||||||
|
|
|
|
|
|||||
| 46 | palladium |
21.175 |
23.816 |
24.297 |
||||
| 47 | silver |
22.162 |
24.942 |
25.454 |
||||
| 48 | cadmium |
23.172 |
26.093 |
26.641 |
||||
| 49 | indium |
24.207 |
27.274 |
27.859 |
||||
| 50 | tin |
25.270 |
28.483 |
29.106 |
||||
| 51 | antimony |
26.357 |
29.723 |
30.387 |
||||
| 52 | tellurium |
27.471 |
30.993 |
31.698 |
||||
| 53 | iodine |
28.610 |
32.292 |
33.016 |
||||
| 54 | xenon |
29.802 |
33.644 |
34.446 |
||||
| 55 | cesium |
30.960 |
34.984 |
35.819 |
|
|
|
|
| 56 | barium |
32.191 |
36.376 |
37.255 |
4.467 |
4.828 |
5.531 |
|
| 57 | lanthanum |
33.440 |
37.799 |
38.728 |
4.651 |
5.049 |
5.789 |
|
| 58 | cerium |
34.717 |
39.255 |
40.231 |
4.840 |
5.262 |
6.052 |
|
| 59 | praseodymium |
36.023 |
49.746 |
41.722 |
5.034 |
5.489 |
6.322 |
|
| 60 | neodymium |
37.359 |
41.269 |
43.298 |
5.230 |
5.722 |
6.602 |
|
| 61 | promethium |
38.160 |
38.649 |
43.945 |
44.955 |
5.431 |
5.956 |
6.891 |
| 62 | samarium |
39.523 |
40.124 |
45.400 |
46.559 |
5.636 |
6.206 |
7.180 |
| 63 | europium |
40.877 |
41.529 |
47.027 |
48.241 |
5.846 |
6.456 |
7.478 |
| 64 | gadolinium |
42.280 |
42.983 |
48.718 |
49.961 |
6.059 |
6.714 |
7.788 |
| 65 | terbium |
43.737 |
44.470 |
50.391 |
51.737 |
6.275 |
6.979 |
8.104 |
| 66 | dysprosium |
45.193 |
45.985 |
52.178 |
53.491 |
6.495 |
7.249 |
8.418 |
| 67 | holmium |
46.686 |
47.528 |
53.934 |
55.292 |
6.720 |
7.528 |
8.748 |
| 68 | erbium |
48.205 |
49.099 |
55.690 |
57.088 |
6.948 |
7.810 |
9.089 |
| 69 | thulium |
49.762 |
50.730 |
57.576 |
58.969 |
7.181 |
8.103 |
9.424 |
| 70 | ytterbium |
7.414 |
8.405 |
9.785 |
||||
| 71 | lutecium |
7.654 |
8.708 |
10.142 |
||||
| 72 | hafnium |
7.898 |
9.021 |
10.514 |
||||
| 73 | tantalum |
8.145 |
9.341 |
10.892 |
||||
| 74 | tungsten |
8.396 |
9.670 |
11.283 |
||||
| 75 | rhenium |
8.651 |
10.058 |
11.684 |
||||
| 76 | osmium |
8.910 |
10.354 |
12.094 |
||||
| 77 | iridium |
9.173 |
10.706 |
12.509 |
||||
| 78 | platinum |
9.441 |
11.069 |
12.939 |
||||
| 79 | gold |
9.711 |
11.439 |
13.379 |
||||
| 80 | mercury |
9.987 |
11.823 |
13.828 |
||||
| 81 | thallium |
10.266 |
12.210 |
14.288 |
||||
| 82 | lead |
10.549 |
12.611 |
14.762 |
||||
| 83 | bismuth |
10.836 |
13.021 |
15.244 |
||||
Chapter 6 -- Other Experiments -- The Half Lives of Silver Isotopes
last rev 3-96