Chapter 6: Other Experiments
Conduction of Heat
References
Crummett and Western, Physics: Models and Applications,
Sec. 18-3
Halliday, Resnick, and Walker, Fundamentals of Physics (5th
ed.), Sec. 19-11
Tipler, Physics for Scientists and Engineers (3rd ed.), Sec.
16-3
Introduction
 The experimental
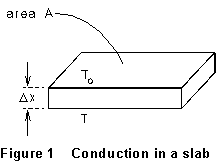
setup is shown in Figure l shows an insulating slab of thickness x
whose top surface is at temperature T0 and whose bottom
surface is at temperature T > T0. Under these
circumstances heat flows from the bottom surface of the insulator toward
the top. The amount of heat
  conducted through any cross-section (area A) of the insulator, per
unit time
  , is
, is
 (1)
(1)
 Here the constant
k is a characteristic of the insulating material called its thermal
conductivity. The conductivity k indicates how good a conductor
of heat the insulating material is. The purpose of this experiment is to
measure the thermal conductivity of an insulating material.
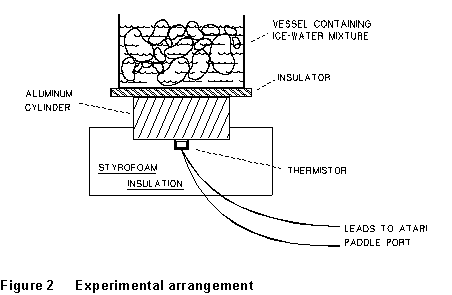
In this experiment the heat which is being conducted upward through
the insulator comes from an aluminum cylinder which is in contact with
the lower surface of the insulator (layout sketch -- Fig. 2). As heat is
conducted upward out of the aluminum cylinder its temperature drops. The
relationship between the amount of heat (dQ) given up by the cylinder
and its temperature change dT is dQ = (mc)dT,
where m is the mass of the aluminum cylinder and c is its
specific heat capacity (c = 0.900 kJ/kg K for aluminum). Since the
heat dQ leaving the cylinder in time dt is the same as the
heat passing through any cross-section of the insulator in time dt (under
steady state conditions assuming temperatures have stabilized), we can
write
 (2)
(2)
where dT is the change in temperature T of the cylinder
and lower surface of the insulator in time interval dt. Assuming
the upper surface of the insulator is held at a constant temperature T0
we can determine how the temperature T of the bottom surface of
the insulator depends on time, as follows:

Integrating this, we get
 (3)
(3)
So if we measure the temperature T of the aluminum cylinder as
a function of time t, and draw a graph of Y = ln(T
- T0) versus X = t, we should get a straight
line of (negative) slope -kA/mcx. The thermal conductivity of the
insulating material, k, may be determined if we know the mass m
and specific heat capacity c of the aluminum cylinder, and the thickness
x and cross-sectional area A through which heat is conducted
in the insulator.
The experimental setup is shown in Figure 2. The temperature T
of the aluminum cylinder will be determined by monitoring the resistance
of a thermistor which is in thermal contact with it. The thermistor resistance
is monitored by an ATARI computer which converts the resistance to an integer
Y (PADDLE(0) number) in the range l to 228 which is proportional
to the resistance. If Rl is the thermistor resistance,
and Yl the corresponding PADDLE(0) integer at temperature
Tl, then the resistance R and PADDLE(0) integer
Y at some other temperature T are given by:
 (T in K)
(4)
Of course, this is no help in terms of using R or Y to
measure temperatures unless  is known for your thermistor, and Yl is known for your
thermistor and computer, at some temperature Tl. Therefore
the first step in doing the experiment is to calibrate your thermistor
and computer for the temperature range which you are going to use in the
experiment.
Equipment
- Calipers or micrometer
- Styrofoam block, aluminum cylinder, ribbon leads
- Insulator
- Aluminum cup
- Atari 800XL, disk drive, monitor
- Disk containing programs "THERMCAL" and "CONDUCT"
Procedure
(1) Plug the thermistor lead ribbon connector into the paddle
port which is nearest you as you face the keyboard. Turn on the disk drive
and load the disk. Turn on the computer. Load the thermistor calibration
program into the computer by typing "D:THERMCAL" and hitting
the <RETURN> key. Type "RUN" (<RETURN> key) and follow
the instructions, as they come up on your screen, to calibrate your thermistor.
Record the constant BETA for your thermistor, and the paddle number YC
and Kelvin temperature TC for your "cold temperature" (cold water
in the aluminum cup). Notice that, since the computer program averages
the paddle integers over 100 trials, YC is not an integer.
(2) To see how the computer calculates temperature, calculate
the temperature that should correspond to paddle integer Y = 175,
using the equation
 (5)
(5)
with T's in kelvins. (Where does Equation (5) come from?)
(3) Load the thermal conduction program into the computer by
typing "LOAD D:CONDUCT" and pressing the <RETURN> key.
Type "RUN" <RETURN> and follow the instructions that come
up on the screen. Use the thermistor calibration constants from part (1).
When you are ready to make a temperature vs. time run, simultaneously place
the ice-water container and insulator on the aluminum container, and press
<RETURN> to start the run. The computer will automatically measure
and record the temperatures at equal (computer) time intervals. At the
end of the run, record the temperatures and times at the end of each interval.
(4) Measure and record the mass of the aluminum cylinder, and
its diameter. Determine the thickness of the insulator.
Analysis
(1) Plot a graph of Temperature vs. time. Then
plot a graph of ln(T - T0) vs. t and determine
the slope of the straight-line portion of the graph (it takes some time,
initially, for a steady-state temperature distribution to be established
throughout the aluminum). Calculate a value for the thermal conductivity
of the insulator. Use the surface area of the aluminum disk for the cross-sectional
area through which heat is conducted to the insulator. (Why? Do you think
this will introduce any systematic error? Explain.)
(2) Estimate an uncertainty in your slope, and calculate the
corresponding uncertainty in the thermal conductivity coefficient k.
Discuss the procedure in your writeup as regards accuracy, possible improvements,
etc., etc. (What are the sources of random error? What are likely sources
of systematic error? How much uncertainty do you feel they introduce into
your measurement of k? Can you suggest any modifications of the
experiment design or procedure that might yield a "better" result?)
Chapter 6 -- Other Experiments
-- Radiative Heat Transfer
updated 6/96
 The experimental
setup is shown in Figure l shows an insulating slab of thickness x
whose top surface is at temperature T0 and whose bottom
surface is at temperature T > T0. Under these
circumstances heat flows from the bottom surface of the insulator toward
the top. The amount of heat
  (1)
(1)  Here the constant
k is a characteristic of the insulating material called its thermal
conductivity. The conductivity k indicates how good a conductor
of heat the insulating material is. The purpose of this experiment is to
measure the thermal conductivity of an insulating material.
 (2)
(2) 
 (3)
(3)  (T in K)
(4)
  (5)
(5)