| Table of Contents |
Crummett and Western, Physics: Models and Applications,
Sec. 37-1
Halliday, Resnick, and Walker, Fundamentals of Physics (5th
ed.), Sec. 17-8, 9
Tipler, Physics for Scientists and Engineers (3rd ed.), Sec.
13-3,5
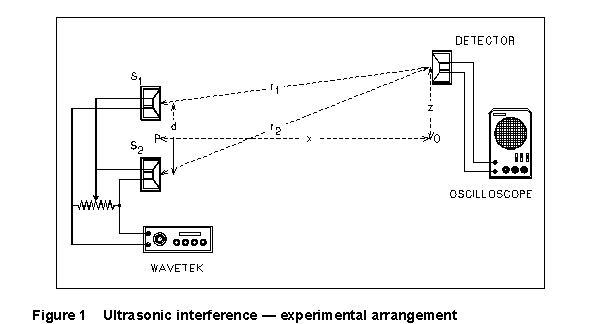
In this experiment, you will use the interference of two ultrasonic waves to determine the speed of sound in air. The experimental arrangement is sketched in Figure 1.
Sources S1 and S2 are transducers which vibrate at the frequency of the oscillator which drives them. Their vibration has a very small amplitude, however, except when the oscillator matches the natural resonance frequency of the transducer (near 40 Khz). With the circuit connected as shown, the sources vibrate one half-cycle (180 degrees) out of phase with one another. Detector D is another transducer which is caused to vibrate by sound waves incident upon it and produces an electric signal which is fed to an oscilloscope.
If the detector were placed at O, it would detect a very weak signal,
because the waves from the two sources would pretty much cancel each other.
(They are 180 degrees out of phase at the sources, and the sources are
equidistant from O). If the detector is moved in the +z direction, however,
the wave from S2 has farther to travel to get to the detector
than has the wave from S1. There will be some point at which
the path length difference (r2 - r1)
is precisely half a wavelength. This lag, together with the 180-degree
phase difference of the sources, causes the two waves to arrive at D in
phase, so they add constructively to give a large signal. As the detector
is moved farther, the detected signal amplitude will decrease again until,
when ![]() , the waves
again tend to cancel and produce a minimum amplitude. At this point
, the waves
again tend to cancel and produce a minimum amplitude. At this point
![]() (1)
(1)
Thus by measuring z - z0, d, and x,
we can find ![]() ; and from
that, the frequency of the source being known, we can calculate the speed
of sound.
; and from
that, the frequency of the source being known, we can calculate the speed
of sound.
Likewise, if the detector is moved still farther out, a second amplitude minimum will be observed when
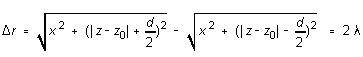 (2)
(2)
. . . and so on.
NOTE: Reflections of the ultrasonic waves from surrounding objects are sometimes a problem in this experiment. Keep the area around the detector as clear as possible, and try to stay in more or less the same positions yourselves throughout the measurements.
(1) Make the connections shown in Figure 1. (Use the HI output of the Wavetek to drive the transducers, and connect the LO output to the frequency meter. Connect the frequency fine-control box to the VCG input.) Set the vertical sensitivity on the oscilloscope for 2 mV/cm and the sweep time for about 0.2 msec/cm. Turn on the oscilloscope and the oscillator; the latter should be left turned on, to stabilize, for about 10 minutes before you make any measurements with it.
(2) Position the two transducers S1 and S2 so that they are as far apart as possible. Use rubber bands to fix them in position, if necessary. Set detector D to the same height above the baseboard as S1 and S2.
(3) Carefully measure the distance between S1 and S2 several times; also measure their diameter several times. Using these values, calculate the best value, with uncertainty, of the distance d between the centers of S1 and S2. Carefully measure and record the distance L between the bracket holding the sources and the one holding the detector; repeat this measurement several times, and calculate the mean value and its uncertainty. Since the vibrating element of these transducers is 1.46 cm from the bracket in which each is mounted, the distance from P to O is x = L - 2.92 cm.
(4) Position the detector about 2 cm to one side of the position corresponding to O. Set variable resistor R to about the middle of its range. Set the oscillator frequency to 38 kHz and the output to maximum. Carefully move the oscillator frequency knob through the frequency range from 38 kHz to 42 kHz or so and note the frequency producing the largest detector signal on the oscilloscope. Use the fine-control box to set the frequency exactly to the value which maximizes the detector voltage. Leave the frequency at this setting, and record its value. (If the frequency drifts in the course of the experiment, you may repeat this step as needed to "re-peak" it, as often as needed.)
(5) Move the detector slowly toward O and find the position at which the detector signal has a minimum value. Adjust variable resistor R to make the signal at minimum as small as possible. Record this value of z0. Now determine the positions corresponding to the first and second minima on each side of O (four z-values altogether). (If you can get the third minimum too, do so!) You can use the scales mounted on the board and a meter stick, but be sure all measurements are made from a common reference point and to the same point on the detector bracket.
(6) Repeat step (5) three more times, exchanging chores with your lab partner each time, so that you end up with four independent determinations of each of the five detector positions. If the peak transducer frequency changes appreciably from one trial to the next, record it at the beginning and end of each trial. You should try to get your readings of z and z0, in any one trial, in as short a time as you can (without sacrificing accuracy), to minimize the effect of any frequency drift.
(7) Position transducers S1 and S2 as close together as possible. Note and record the effect, on the spacing of interference minima at D, of reducing the spacing d between the two sources.
(8) Simulate your experiment in the rhwaveint program. Under N Source Interference/N Sources in a Line, let each screen unit be 1mm. Set the source separation to 100 (mm) and put in your wavelength value (in mm.) Go to More Plot Parameters and set Src-Src phase Diff to Pi. This puts the sources out of phase. Set the maximum pixel to plot to 370. Return to the previous panel and Do New Grayscale Plot. Now move the mouse into the grayscale area, then out to x=400. Locate the first two minima on either side of center and record the values. These can be compared to your experimental results.
Predict what will happen if you reduce the separation to 80 mm between the sources. Will the minima get closer together or farther apart? Write down some careful reasoning on this point. See if the simulation agrees with your prediction.
(1) You've made eight determinations of the position (z)
of the first minimum (four on either side of z0).
Make a table showing, for each, z - z0 (use your
mean value for z0), r1, r2, and
![]() , and the wavelength
, and the wavelength
![]() calculated from
Equation (1). Calculate the mean value and standard error of
calculated from
Equation (1). Calculate the mean value and standard error of ![]() .
.
(2) Repeat step (1) for the eight values of the second minimum distance. Is your mean value consistent (within experimental errors) with that of step (1)?
(3) Find an overall mean value for ![]() .
Find the mean and standard error of your recorded values of the transducer
peak frequency f0. From these, calculate the speed of
sound in air, and a corresponding uncertainty. How does this result compare
with the actual speed of sound in air?
.
Find the mean and standard error of your recorded values of the transducer
peak frequency f0. From these, calculate the speed of
sound in air, and a corresponding uncertainty. How does this result compare
with the actual speed of sound in air?
Chapter 5 -- Waves Experiments -- Laser Interference and Diffraction
last update 6/96