Chapter 5: Waves Experiments
Laser Interference and Diffraction
References
Crummett and Western, Physics: Models and Applications,
Sec. 37-1, 38-1,2
Halliday, Resnick, and Walker, Fundamentals of Physics (5th
ed.), Sec. 36- 1,3,4; Sec. 37-3,4,6
Tipler, Physics for Scientists and Engineers (3rd ed.), Sec.
33-4,7,8
Introduction
 Interference
is the cancellation or reinforcement that occurs when two or more waves,
from different (coherent) sources, are present at the same point. Diffraction
is the bending or spreading of waves from a source or aperture of finite
size. In this experiment, you will observe the effects of interference
and diffraction of light waves, and use them to determine the dimensions
of various small apertures.
Interference
is the cancellation or reinforcement that occurs when two or more waves,
from different (coherent) sources, are present at the same point. Diffraction
is the bending or spreading of waves from a source or aperture of finite
size. In this experiment, you will observe the effects of interference
and diffraction of light waves, and use them to determine the dimensions
of various small apertures.
Both interference and diffraction may be analyzed by considering how
waves which have traveled different paths combine at various points in
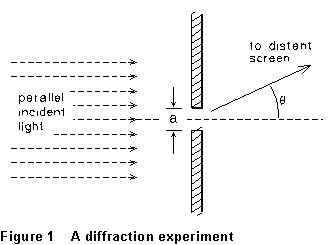
space. For example, consider a beam of parallel monochromatic light incident
upon a barrier in which there is a narrow slit, as in Fig. 1. If the slit
width (a) is not very large compared to the wavelength of the light,
some light will spread into the regions in which, geometrically, one would
expect to see shadow. The intensity distribution of the light on a distant
screen will be something like that drawn in Fig. 2.
This pattern can be constructed by considering the superposition of
"wavelets" reaching the screen from different parts of the slit
opening. These differ in phase, because of the different path lengths they
have had to travel. At certain points on the screen (certain directions ),
all these wavelets cancel one another, and the intensity of light
reaching the screen is very small, or even zero. These intensity minima
are in directions
),
all these wavelets cancel one another, and the intensity of light
reaching the screen is very small, or even zero. These intensity minima
are in directions  given by
 for n =
1, 2, 3, 4, . . . (l)
for n =
1, 2, 3, 4, . . . (l)
The intensity maxima are approximately halfway between the minima.
 Now consider
a beam of parallel monochromatic light incident on a barrier in which there
are two parallel narrow slits, as in Figure 3. The slits have width
a and a center spacing d. Light that reaches a point on the
screen from the center of one slit will have traveled a shorter distance,
shorter by an amount d
Now consider
a beam of parallel monochromatic light incident on a barrier in which there
are two parallel narrow slits, as in Figure 3. The slits have width
a and a center spacing d. Light that reaches a point on the
screen from the center of one slit will have traveled a shorter distance,
shorter by an amount d  ,
than light reaching the same point from the other slit. If this distance
is just
,
than light reaching the same point from the other slit. If this distance
is just  (or
(or  ,
,
 , etc.), light from
the two slits will be exactly
, etc.), light from
the two slits will be exactly  (or
(or  ,
,  ,
etc.) out of phase at the screen, and cancel. These interference minima
will, therefore, occur at angles given by
,
etc.) out of phase at the screen, and cancel. These interference minima
will, therefore, occur at angles given by
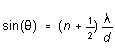 (2)
(2)
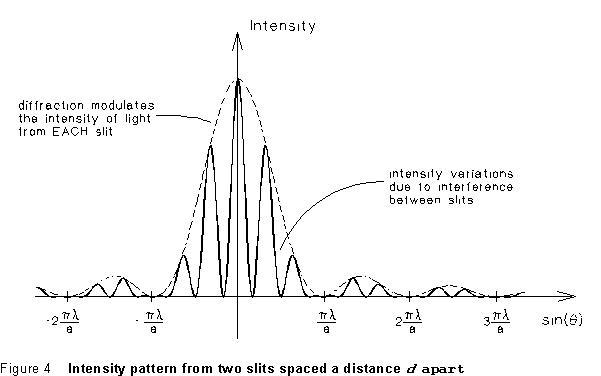
for n = 1, 2, 3, . . . But the intensity of light coming from
each slit has an intensity pattern like that of Figure 2, due to
diffraction; thus the interference pattern described by (3) modulates
this pattern, and the resultant intensity pattern is like what's shown
in Figure 4.
Equipment
- helium-neon laser (
 )
)
- support bench
- apertures:
- (1) plate with single slits of different widths
- (2) plate with both single and double slits
- Computer running SERANGLE.EXE
- photodetector
Procedure
The object of the exercise is to measure the interference/diffraction
patterns produced by each aperture, and infer the aperture dimensions.
The patterns will be measured by you directly, and also using a computer-driven
photoelectric detector to take data automatically. For comparison, you
can also measure the aperture dimensions directly.
The photodiode detector is mounted behind a slit to detect light diffracted
at a particular angle. The photodiode mount is connected to a pulley and
shaft encoder to observe its motion when the detector is moved. A three-position
switch controls the gain of the light detector circuit; the highest gain
is on setting C and the lowest gain is on setting A.
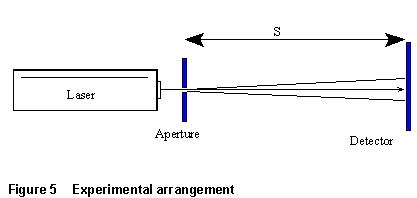 (l) Set
up the apparatus as indicated in Fig. 5. The "screen" is the
location at which the pattern is observed -- either on the wall of the
lab, or at the computer-driven photo-detector.
(l) Set
up the apparatus as indicated in Fig. 5. The "screen" is the
location at which the pattern is observed -- either on the wall of the
lab, or at the computer-driven photo-detector.
(2) Aim the laser beam directly at the photodetector. Make sure
that the laser is at the right height; the beam should hit the photodetector
in between the two screws.
(3) You will need the aperture-to-detector distance in the laboratory.
This should be measured at the start of the lab period. Each team of students
should make whatever other measurements are necessary to obtain the distance
s from the apertures to the points where the interference and diffraction
patterns are being observed.
(4) First, using the narrowest of the single slits, record the
diffraction pattern directly, by holding the laboratory notebook itself
against the wall, and marking the positions of as many dark spots or zones
as is feasible. Record all significant features of the pattern you see.
(5) Now you will use the computer to record the same data more
precisely. First set up the hardware. The detector has a (round)
DIN connector and a 9-pin D subminiature connector which must be connected
to a black interface box. The box must be connected to a wall plug for
DC power (via a small cylindrical connector), and to the computer via a
25-pin connector to the printer port connection (often labeled 'LPT1').
The switch on the front of the black interface box should be flipped
toward the round DIN connector.
(6) Computer program: (In what follows <> refers
to a keystroke: <Esc> means press the Esc key.) The program is called
'serangle.exe'. If your PC is connected to the network, this program should
automatically come up when you boot up the network. (BUG: when serangle
launches from the network, it somehow winds up in the second menu, so you
<Esc> back to the main menu.) Serangle.exe is also on the a: drive
on old PCs, and in the c:\lab directory on some 486 PCs.
Select 'Prefs, Info, Hardware Check' on the main menu, then select 'Check
The Hardware' (item 4). Now you are ready to make sure the computer inputs
are behaving properly. Press <1> or <Enter> and you will see
the bit patterns for shaft encoder input. Rotate the shaft encoder slightly
and make sure that two adjacent bits are changing. Then leave this part
of the program and press <2> to examine the A/D converter input (from
the light detector). It should be near zero volts if not in the laser beam
or diffraction pattern, and it should be between 1 and 6 volts with light
shining on the slit. Check with the lab instructor or assistant if this
doesn't seem to be right. <Esc> several times to return to the main
menu.
Press <6> twice from the main menu. This first selects "Set
Angle Data Parameters." Press <Enter> and set the number of
data points to 1000. Press <6> again for the "More Angle Data
Parameters" menu, and make sure that "Hit Key to Quit Taking
Data" is set to True. Press <3> to toggle the positive angle
direction CW to CCW. <Esc> to return to the previous menu, and make
sure that the rest of the menu choices are OK (Take every Nth point = 1,
Record All Points). You are now ready to take data. <Esc> back to
the front menu, and <Enter> or <1> to be ready to start taking
data.
(7) Determine the Pulley Radius: On the length scale on
the front of the detector housing, select a starting and an ending point
for the detector to travel, at least 5 cm apart. Put the detector
at the starting position, and press a key to start taking data. Slide the
detector to the ending position and press a key to stop taking data. Graph
angle vs. time. Record the final and initial angles on the graph,
and determine the total angle traveled. The linear distance traveled
divided by the angle traveled will be the pulley radius.
Repeat this procedure twice more, and make sure your results are consistent.
Determine the mean value and standard error of the pulley radius R.
Do a reality check on your result by roughly measuring the pulley diameter.
Record all this information in your lab notebook. Enter the pulley
radius under "Set Angle Data Parameters" (this will automatically
reset the display from "Angular" to "Linear."
(8) To adjust the quality of the diffraction pattern, you must
have a parallel beam of light striking the aperture in order to have a
good quality diffraction pattern. Use a card to check the beam size, drawing
a rough circle the size of the beam on the card. When the beam is parallel,
you may move the aperture into the beam. Adjust height of diffraction pattern.
You must make sure the diffraction pattern you want to record is striking
the detector at the same height as the light detector. Adjust the laser
as necessary to have the beam at the right height.
(9) Now you are ready to take data (at last!) Start with the
plate one containing only single slits, and with the narrowest slit. Set
the encoder at one end of the diffraction pattern. Press any key to begin
taking data. Move the detector slowly (in 3 to 10 seconds) through the
pattern (it's ok to reverse direction if you get to the end). A small sound
will be made when the data is complete. Press any key except <Y>
or <y> or <Esc> and you will return to the main menu; then
press <5> to see the graph of light intensity vs. angle (or light
intensity vs. distance when you have determined the pulley radius and installed
it in the software).
For the single slit diffraction pattern, try using the lowest gain (A)
first. This will give you your best chance to find the first minimum, next
to the big peak in the middle. Use the software (remember that F1 will
bring up a small help menu on the screen) to locate as many maxima and
minima as you can (3 max's and 3 mins on each side will be sufficient).
Write the values in your lab notebook. If you cannot locate enough peaks
on low gain, try the high gain setting (C).
(10) Repeat the single slit part of the experiment with two of
the narrowest slits from the plate one, and with the two single slits from
the plate two. Notice that the second plate is ruled with 2 pairs of slits,
each pair of lines has 2 different lengths; one runs all the way across
the plate; the other stops halfway. Record data from the four single slits
(two from the plate one and two from plate two); each partner should make
a separate trial for each slit. Record pertinent data each time.
(11) On the plate two there are two pairs of double slits also,
one with about twice the separation of the other and of slightly different
width. The width is the same as the width of the counterpart single slit,
which by this time you have already worked with. For the double slit diffraction
pattern, use the highest gain (C). Make a sweep with the detector and show
the pattern on the screen. Use the software to locate all maxima and minima
in the pattern which are clearly defined.
(12) For each of your interference/diffraction patterns, make
sure that your computer output is consistent with the patterns recorded
in your notebook. After you have finished, let your instructor look over
your data before you leave.
Analysis
Plot a graph from data obtained from each of the single slits; this
will be a plot of sin vs. n, a straight line with a slope equal to
  .
Find the values for a, the widths of the single slits.
.
Find the values for a, the widths of the single slits.
Notice that, in the setup you'll be using here, the angles  in Equation (l)-(3) are in all cases very small. Thus, the position of
a maximum or minimum on the distant "screen" is given by
in Equation (l)-(3) are in all cases very small. Thus, the position of
a maximum or minimum on the distant "screen" is given by
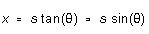
so that  (4)
(4)
Thus the interference minima from the double slit should be at angles
 such that
 or
or 
-- which means they should be evenly spaced on the screen, with spacing
 . Find the values
of d and a of the two double slits.
. Find the values
of d and a of the two double slits.
Describe and explain the features you observe in the interference and
diffraction patterns. For instance, do you see a "two-way" pattern
from the single slit? If so, why? What is the effect of the width
of each slit on the two-slit interference pattern?
Chapter 5 -- Waves Experiments -- Lenses
revised MJM 7/97