Chapter 5: Waves Experiments
Prism Spectrometer -- Dispersion Curve for Glass (Version 2)
References
Crummett and Western, Physics: Models and Applications,
Sec. 36-1,4
Halliday, Resnick, and Walker, Fundamentals of Physics (5th
ed.), Sec. 34-7,8
Tipler, Physics for Scientists and Engineers (3rd ed.), Sec.
30-4
Introduction
In this experiment, you will have an opportunity to (1) determine the
index of refraction of a glass prism as a function of wavelength; (2) become
familiar with the Newton-Raphson method, an important numerical method
for solving transcendental equations by successive approximations; and
(3) practice your computer programming skills on a simple, straightforward
problem.
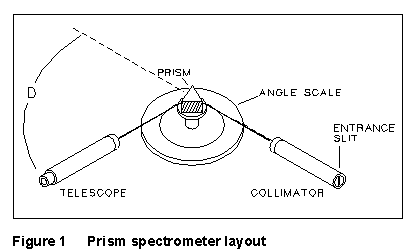 The geometry
of the prism spectrometer to be used is shown in Figure 1. Light from a
source S is passed through a collimator, in which the light rays
are refracted parallel to the axis, and strikes a glass prism. It is refracted
at each of the prism surfaces, and enters a telescope through which the
refracted light can be viewed. The total angle through which light has
been deflected is D in Figure 2. This angle D will depend
on the angle of incidence at which light strikes the prism
The geometry
of the prism spectrometer to be used is shown in Figure 1. Light from a
source S is passed through a collimator, in which the light rays
are refracted parallel to the axis, and strikes a glass prism. It is refracted
at each of the prism surfaces, and enters a telescope through which the
refracted light can be viewed. The total angle through which light has
been deflected is D in Figure 2. This angle D will depend
on the angle of incidence at which light strikes the prism  ,
the prism's apex angle (A), and the wavelength of the light.
,
the prism's apex angle (A), and the wavelength of the light.
 Figure 2 shows
the geometry used in determining the index of refraction of a glass prism.
The incident light consists of several discrete wavelengths which are refracted
different amounts at the first and second prism surfaces (the figure shows
the path for only one of these wavelengths). In general, the index of refraction
of the prism will be different for each different wavelength of light.
When you look through the telescope at light that is not monochromatic,
therefore, you will see a separate image of the collimator entrance slit
in light of each wavelength. (Each image is a vertical line, so one speaks
of light containing different discrete wavelengths of light as producing
a "line spectrum.")
Figure 2 shows
the geometry used in determining the index of refraction of a glass prism.
The incident light consists of several discrete wavelengths which are refracted
different amounts at the first and second prism surfaces (the figure shows
the path for only one of these wavelengths). In general, the index of refraction
of the prism will be different for each different wavelength of light.
When you look through the telescope at light that is not monochromatic,
therefore, you will see a separate image of the collimator entrance slit
in light of each wavelength. (Each image is a vertical line, so one speaks
of light containing different discrete wavelengths of light as producing
a "line spectrum.")
For a given spectral line the second surface angle of refraction  may be found from
 (1)
(1)
(you will need to prove this). Applying Snell's law at each surface
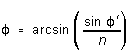
so 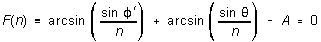 (2)
(2)
 For a given
spectral line, the only unknown in the above equation is n. However,
the equation is transcendental, and there is no way of solving explicitly
for n. Instead we need some kind of systematic method of approximating
the value of n that makes F(n) = 0.
For a given
spectral line, the only unknown in the above equation is n. However,
the equation is transcendental, and there is no way of solving explicitly
for n. Instead we need some kind of systematic method of approximating
the value of n that makes F(n) = 0.
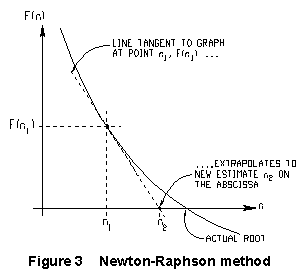
The Newton-Raphson method is one such. Suppose that a graph of F(n)
vs. n looked something like Figure 3. If you had some initial guess
(call it n1) for the value of n for which F(n)
= 0, you could get a better guess (n2, say) by extrapolating
the slope of the graph from n1 until it hits the
line F(n) = 0. (The extrapolation is shown in Fig.3 by a
dashed line.) We know the formula for the slope of a straight line:
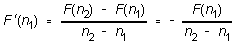
and so 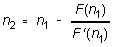
We can repeat the procedure using n2, get a still
better approximation n3, and so on and on:
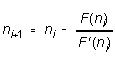 (3)
(3)
-- continuing to repeat the process until the change in n as
small as we wish. This is the Newton-Raphson method.
Equipment
- Gaertner student spectrometer
- glass prism
- multiple light source
The spectrometer is a frame (see Figure 1) upon which the collimator,
prism support, and telescope are mounted in such a way as to allow them
to rotate separately around a common axis. An angle scale is provided which
allows measurement of the angular position of the telescope to within one
minute of arc. The spectrometers should already have been aligned before
you use them, so that the objective lens of the telescope brings the parallel
light from the collimator into focus exactly in the plane of the cross
hairs, and so that telescope, collimator, and prism table are all rotating
about the same axis.
| Please do not adjust the position of the collimator lens or the
telescope objective lens. Do not disturb the leveling screws of the prism
table, telescope, or collimator. If you think the alignment of your instrument
needs adjustment, call the instructor. |
A large thumbscrew near the axis of the instrument, about an inch above
scale level, clamps the telescope. Large adjustments of the telescope position
are made by releasing this screw. A second large thumbscrew at the same
height, at the base of the telescope, provides fine adjustment of the telescope
position. The prism table assembly rides on a collar which is clamped in
place by a smaller thumbscrew, fixing its height. The table is clamped
against rotation by another screw about 4 cm below the prism table; loosening
this screw allows the prism table to rotate about the spectrometer axis.
At the source end of the collimator, there is a small thumbscrew which
adjusts the width of the entrance slit. This lets you use a wide slit,
admitting lots of light, to find your way around; and then narrow the slit
for precise angle measurements. This, and the four thumbscrews mentioned
in the last paragraph, are the only adjustments you should have to make
on the spectrometer.
The angular position of the telescope is read on a circular scale fastened
to the base of the instrument. Main scale divisions are 0.5 degree apart,
and they are subdivided by a 30-part vernier scale (see Sec. 2-1), so you
can read the scale to one minute of arc. For example, if the index falls
between 153.5 degrees and 154 degrees on the main scale, and the 19th vernier-scale
mark lines up, the angle reading is 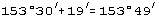 .
You may occasionally want to read the scale to half a minute of arc, if
two adjacent vernier-scale marks seem equally well aligned. Note that the
angle that the scale reads is not D (in Figure 2), but approximately
180 degrees ± D.
.
You may occasionally want to read the scale to half a minute of arc, if
two adjacent vernier-scale marks seem equally well aligned. Note that the
angle that the scale reads is not D (in Figure 2), but approximately
180 degrees ± D.
Procedure
| NOTE: This experiment can be a highly precise one if you are careful
about your angle measurements and careful to identify wavelengths correctly.
Since deciding just when the cross hairs are exactly aligned with the image
is a matter of some judgement, it would be wise to repeat all these determinations
several times. This will also give you some sense of how precisely you
can locate a "line" (i.e., a slit image). |
(1) With no prism on the spectrometer table, swing the telescope
around until the light coming directly from the collimator is observed.
Set the telescope so that this image of the slit falls on the cross hairs,
and record the reading on 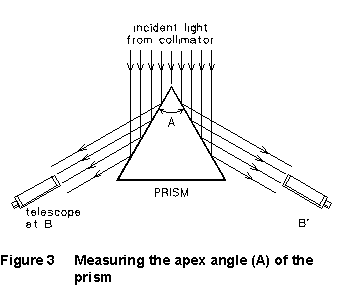 the
angle scale. Repeat this measurement several times.
the
angle scale. Repeat this measurement several times.
(2) Place the prism on the spectrometer table so that the apex
of the prism points directly at the collimator, as in Figure 4. Re-tighten
the screw. Illuminate the slit using the white (incandescent) bulb in your
multiple light source, and rotate the telescope until the image of the
slit, reflected from the side of the prism, can be seen. (This is
position B in Figure 3). If you can't find the image, get your instructor
to help you. Clamp the telescope position, and use the fine adjustment
screw to set the image of the slit exactly on the cross hairs. Read and
record the angular position of the telescope. Unclamp the telescope and
rotate it to position B'; re-clamp it and use the fine-adjustment screw
to set the cross-hairs on this image of the slit, and read and record the
telescope angle. The angle through which the telescope has been rotated
between B and B' is twice the apex angle (A) of your prism; you should
prove this in your write-up.
(3) Using the mercury source, position the prism on the table
in an orientation like that in Fig. 2, one that gives a good line spectrum
due to the refraction at the two prism surfaces. Measure the angular position
of the rays reflected at the first surface, and use this measurement to
calculate the angle of incidence  .
.
NOTE: From here on, you must be very careful not to disturb the
position
and orientation of the prism throughout the rest of the measurements. |
(4) Measure the angular positions of each of the spectral lines
formed by refracted light. Calculate deviation angles D for each
of the spectral lines.
(5) Repeat steps (3) and (4) for light striking the other
side of the prism. That is, if in (4) you were looking at light deflected
to the left, repeat using light deflected to the right.
Analysis
(1) Justify each of the angular relationships given beside the
figure on the first page. Then prove that  ,
and that
,
and that  . Finally,
starting from Snell's law, prove that the equation for F(n)
is correct.
. Finally,
starting from Snell's law, prove that the equation for F(n)
is correct.
(2) Write a computer program, in any language, that will calculate
an index of refraction n for each of your determinations of each of the
spectral lines, using the Newton-Raphson method of successive approximations.
Your writeup should include a listing of your program and a table of n
values obtained and corresponding wavelengths.
(3) Check the results of your computer program by using one of
your indices of refraction to calculate the corresponding deviation
angle D, using Snell's law at each surface. Compare this calculated
value of D to that measured.
(4) For your prism, plot graphs of index n vs wavelength
and n vs  .
(EXCEL works well.) Do a least squares straight line fit on of the latter
graph in order to find the constants in the equation
.
(EXCEL works well.) Do a least squares straight line fit on of the latter
graph in order to find the constants in the equation  .
Also calculate uncertainties in these values.
.
Also calculate uncertainties in these values.
Chapter 5 -- Waves Experiments
-- Ultrasonic Double Source Interference
last rev 1/94