| Table of Contents |
It's frequently the case that the final result you want to get from your experiment is determined from a graph of a set of data; most often, as the slope of a straight line. Then you must know how to estimate the uncertainty in determining the slope of a graph. If you do a best fit to the data there is an analytic method for estimating the error; but you can get a pretty good estimate just from looking at your graph.
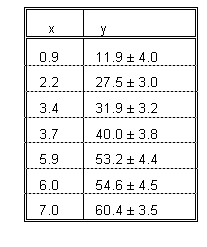
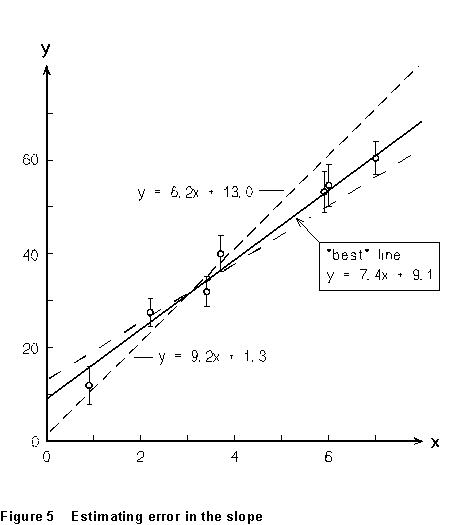
As an example, suppose you've done some experiment and taken the data tabulated at right. (Having error estimates on the individual values of either or both variables will improve your estimate, but it isn't essential.) Plot these on a graph, as in Figure 5, and draw what looks to you like the best straight line through all
 of the data points.
Then draw another line with the steepest slope you think could be consistent
with all the data - this is the dashed line "B" in the figure;
and a third line (dot- dash line "A") with the lowest slope you
can see your way clear to drawing. Experience says that the range
of slopes you determine in this way will be plus or minus two to three
standard deviations of the slope. For example, in Figure 5, the range
of slopes is from 6.2 to 9.2, with a "best" value of 7.4.
The standard deviation of the slope is thus around 0.5 to 0.75, and I might
estimate the slope of the graph to be 7.4 ± 0.6.
of the data points.
Then draw another line with the steepest slope you think could be consistent
with all the data - this is the dashed line "B" in the figure;
and a third line (dot- dash line "A") with the lowest slope you
can see your way clear to drawing. Experience says that the range
of slopes you determine in this way will be plus or minus two to three
standard deviations of the slope. For example, in Figure 5, the range
of slopes is from 6.2 to 9.2, with a "best" value of 7.4.
The standard deviation of the slope is thus around 0.5 to 0.75, and I might
estimate the slope of the graph to be 7.4 ± 0.6.