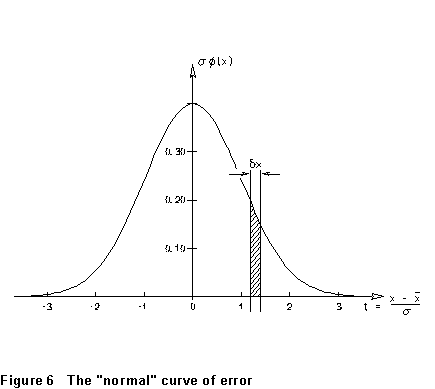
 The normal error
curve has a "bell" shape like that sketched in Fig. 6. The peak
is at the mean value of x, while the width of the "bell"
is proportional to the standard deviation.
The normal error
curve has a "bell" shape like that sketched in Fig. 6. The peak
is at the mean value of x, while the width of the "bell"
is proportional to the standard deviation.| Table of Contents |
Up to now, I've given you some methods and some rules for elementary statist-ical analysis of random errors. Before we leave the subject, I want to talk a little about what it is that we're doing. (The material I'm going to discuss here isn't necessary to make use of what we've done so far.)
Suppose I've measured the magnetic field in some situation as 0.663 ± 0.006 tesla. Just what is it that my "error limit" tells me? Common usage is that it means the standard deviation that I associate with the final, overall value I quote -- that is, the standard error. If I mean something different from this (say, plus or minus two standard deviations), I should have said so explicitly. It follows, of course, that what's given is not meant to be an absolute error limit. The value I gave above doesn't mean that I think it's impossible that the true value is, say, 0.674 T; but just that such a value is substantially less likely to be true than one within the quoted range. The true value could, in principle, be anything; what an experiment does is to identify (in a more or less standardized fashion) an interval within which I think the true answer probably lies.
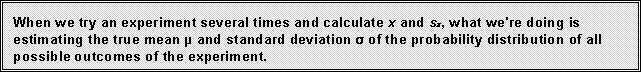
There is some probability distribution of all the possible outcomes of an experiment. What we're doing when we calculate the mean and standard deviation from repeated trials of an experiment is to estimate two parameters (clearly the two most important ones) of that distribution; if we wanted to determine the distribution in detail, we'd have to repeat the measurement, under identical conditions, very very many times. In practice, of course, this is almost never possible. But in most cases, what we would find if we could do this is that the distribution of our results would display a characteristic shape, called the normal curve of error or the normal distribution function. (In particular, whenever the fluctuations in a result arise from variations in many different, independent quantities, the result tends to be distributed normally, no matter what the statistics of the individual quantities are like. I don't propose to prove this to you, but it follows from something called the "central limit theorem.")
The normal error
curve has a "bell" shape like that sketched in Fig. 6. The peak
is at the mean value of x, while the width of the "bell"
is proportional to the standard deviation.
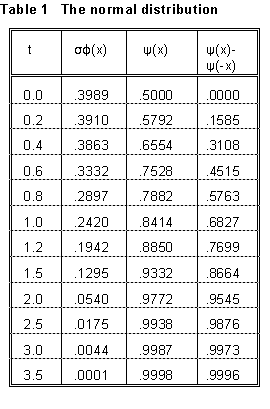
The meaning of the normal distribution can be expressed as follows. The probability that the result of a measurement will fall between x and x + x, where x is some small interval in x, is given by x)x, where
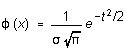 (14)
(14)
with ![]()
is called the error function (sometimes, erf(x)). (x) is maximum at x = the mean value µ (that is, t = 0), and symmetric about the maximum. The width is determined by the "scaling parameter" called the standard deviation; when t = ±1 (that is, when x = µ ± ), (x) is down to about 0.6 of its peak value.
Here is what a probablity distribution or density function like (x) means: the probability that a measurement will give a result in some finite interval, say between x1 and x2, is
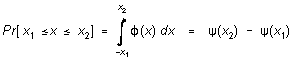
where 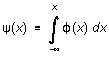 (15)
(15)
is called the integral error function. The integration of (15) can't be carried out in terms of elementary functions, but (x) (integrated numerically) is tabulated in many textbooks. (A brief tabulation appears in Table 1 at the end of this section. In the table, the significance of ((t) - (-t)) is that it is the probability that a measurement will fall between (µ - t) and (µ - t) -- that is, within t standard deviations of the mean value.
Unless you have some strong reason to believe otherwise, you can always
assume that random errors are distributed normally. What this assumption
does for you is that, from it, you can draw various statistical conclusions
from a relatively small sample of data. For instance, I used it to
draw Figure 4, from which you can estimate the standard deviation of a
set of data from its range.
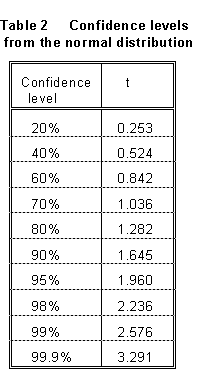
From Figure 6, Equation (15), and Table 1, we have the following interpretation of the "standard deviation": the probability that a given observation of x will fall within one standard deviation of the mean is 0.683. Another way we sometimes say this is that, when we observe a given value of x, we have "68.3% confidence" that the true value lies within one standard deviation of it. Various other often-used ways of expressing error limits are obtained from this concept. For example, the "90% confidence limit" means a value of such that the probability of obtaining a value between (x - ) and (x + ) is 0.900. From Table 1, we find that this is 1.64. Limiting deviations for other confidence levels are shown in Table 2.
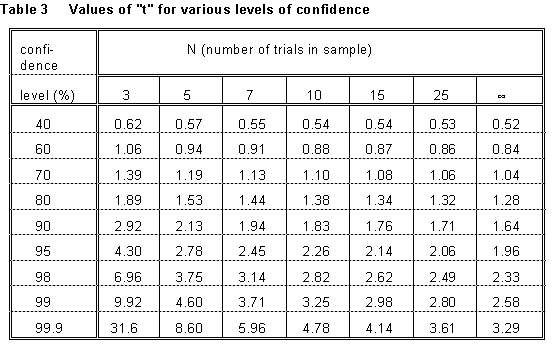
(In the usual experiment, there's a complication here, because we don't know what is! We only have an estimate of it, sx, which we've made from a limited sample of data. Thus to obtain a given degree of confidence, we have to widen the interval, to allow for the possibility that the estimate of itself is off. For this purpose, a distribution that statisticians call the "t distribution" is used. Some values are given in Table 3 at the end of this section. So, for example, if we want to express the uncertainty of a result as a 90% confidence limit, and the result is the mean of a sample of 5 trials, the interval we should quote is ±2.13 standard errors (remember that the standard error is the standard deviation of the mean value) - not the ±1.64 standard errors that the previous paragraph would suggest.)
All of this is doubtless more than you wanted to know about quoting error limits, and for your purposes it'll be sufficient just to give the mean and standard error of your sample of data.
I said at one point that genuine mistakes aren't, properly speaking, what we mean by "errors," because one can usually identify and eliminate them. One very useful result we can get from knowing (or assuming we know) the distribution of random errors is an idea of when a measurement is so far out of line with the rest of a set of data that it probably reflects an outright mistake of some kind, and ought to be discarded. The most commonly used rule is called Chauvenet's criterion. What one wants to know is a value of C such that, for the normal distribution that best agrees with all our data, not even one value as far from the mean as C should have been expected. Knowing the normal error distribution, this isn't hard to work out. For example
for 5 trials C = 1.64
10 trials C = 1.96
20 trials C = 2.24
... where is estimated by the sample standard deviation s (calculated from all the data). There's some justification for feeling that a value lying well out of the range x ± C probably resulted from a mistake of some kind, and should be excluded. (Most elementary lab experiments don't allow time for large numbers of trials, and for simplicity Chauvenet's criterion is sometimes reduced to the "rule of thumb" C 2.)
As an example: I measured the resistance of twenty commercial (nominally 470, 5% tolerance) resistors with a Wheatstone bridge, and got the following results:
469.8, 468.3, 472.8, 466.5, 482.8
465.7, 460.6, 464.1, 471.0, 480.5
488.5, 477.7, 465.9, 478.1, 470.4
473.2, 463.2, 464.3, 472.2, 462.8
The cumulative distribution of the twenty values is graphed in Figure
7 below, compared to the integral normal distribution function with the
same mean and standard deviation; all in all, they agree. The mean and
standard deviation of this data set are 470.9 and 7.4, respectively. The
standard error is ![]() .
Note that the "true" value of 470 is within one standard error
of the mean, and that the manufacturer's tolerance of ± 5% (about
three standard deviations) does include all the measured values. My overall
mean value is thus 471 ± 2 (or perhaps 470.9 ± 1.7). If I
wanted to give a 90% confidence interval instead, it would be (see Table
3)471 ± 3.
.
Note that the "true" value of 470 is within one standard error
of the mean, and that the manufacturer's tolerance of ± 5% (about
three standard deviations) does include all the measured values. My overall
mean value is thus 471 ± 2 (or perhaps 470.9 ± 1.7). If I
wanted to give a 90% confidence interval instead, it would be (see Table
3)471 ± 3.
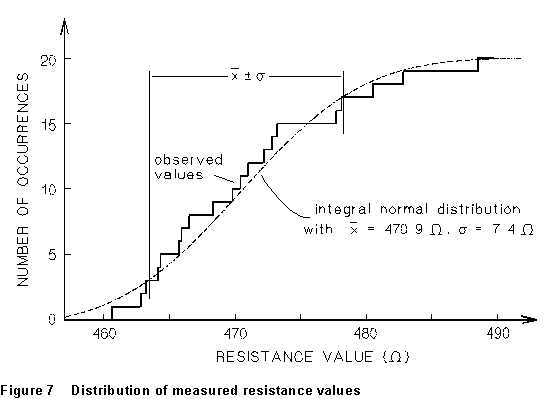
For normally distributed data, 68% of the values should be within one standard deviation of the mean, and 95% within two standard deviations. Thus here we expect 13 or 14 values out of 20 to lie between 463.5 and 478.3 (14 are observed to do so), and 19 values between 456.0 and 485.8 (19 observed).
What about Chauvenet's criterion? Is there any one of these values that's so inconsistent with the others that we can identify it as some kind of bludge? The obvious candidate is the value 488.5. It is 2.35 standard deviations from the mean, whereas the Chauvenet cutoff for 20 trials is 2.24 , so it might be permissible to discard it. (Doing so would change the sample mean and standard deviation to 470.0 and 6.4, respectively.) But one ought, in general, to be very reluctant to throw away data, and I for one would not discard this borderline value.
Some values of the error functions discussed in this section are tabulated below.