Introductory Laboratory Apparatus
Apparatus Title: LED Laboratory and Demonstration Device (LED-LDD)
Abstract
By exploring the changes in light emission of LEDs as a function of the applied voltage students can learn about energy bands in solids and determine Planck's constant. With this Device students can explore these phenomena or instructors can demonstrate them.
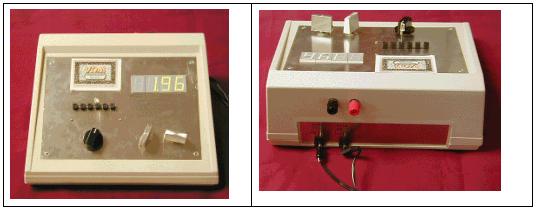
Sketch of the apparatus
Description
By exploring the changes in light emission of Light Emitting Diodes (LEDs) as a function of the applied voltage students can learn about energy bands and gaps in solids and determine a value of Planck's constant. The LED Laboratory and Demonstration Device provides a convenient tool for students to explore these phenomenon or for instructors to demonstrate them to classes. This device can hold up to six different LED's and/or small incandescent light bulbs. A switch allows users to select one of the light sources for experimentation. A digital voltmeter with a large LED display provides a clear view of the readings in a medium-sized classroom. The integrated design makes the unit easy to set up the lab and durable for students' use. This easy-to-use device can often make experiments go smoothly and students can be more focused on the physics content of the lab rather than on the hassles of performing the lab.
This instrument provides the basic functions for experiments with LED's including an adjustable power supply (0 - 7.0 V, 200 mA Max) with a current limiter (needed for control the non-linear behavior of LED's), a digital voltmeter to measure the voltage across the LED, and easy selection/comparison of different LED's.
The instrument is built in a box of 0.25m x 0.20m x 0.10m with a tilted top panel. On the panel are a four-digit LED display for showing the results of the embedded digital volt-meter, an array of six LED/light-bulb holders which are connected to a rotary selector, two output voltage adjustment knobs (coarse and fine). Two AC-DC adapters (9 V 300 mA) are required for operation of this unit. An auxiliary voltage out-put channel is designed with two banana connectors on the back. This gives the flexibility to use this unit in other experiments (e.g. using LED's that cannot be placed on this instrument) and can provide an easy link to share the signal with other instruments such as computer sensors.
This device can be used at several different levels of sophistication, depending on the additional equipment available and the goals of the experiment. For an exploration of the difference between LEDs and incandescent light sources students can place LEDs in each of the sockets. Inserting the LEDs in the order of the spectral colors (red in the first socket, up to blue in the last) students can quickly and dramatically see that the threshold voltage for light emission is related to the color of light emitted. When the red LED turns on, they switch to the next (say, yellow). It is not on, but a small increase in voltage turns it on. The pattern continues through the blue LED which turns on at a considerably higher voltage than the red one. (We recommend using LEDs with clear plastic covers so that the students can see that the color comes from the solid inside and not from a filter.) The students can then repeat the experiment with small Christmas lights. Here threshold voltage does not depend on color and the students see that the two light emission processes are the result of different physical phenomena.
Measurement of Planck's Constant is possible in several ways. In the simplest mode the students increase the voltage while visually observing the light emission from the LED. They record the threshold voltage for each LED and view the spectrum of the LED with a simple spectroscope. Plotting threshold voltage vs. frequency of peak light output provides a value of h/e. Previous published descriptions1,2 of this method have used the current through the LED to determine the threshold. This approach has been criticized has not being entirely accurate.3,4 In our method we focus on the light emitted and thus emphasize the quantum nature of the LED. It is a good approximation and provides rather good results.
A greater degree of accuracy can be obtained by using a photometer such as the Pasco 9152A. With this measurement the students do not need to rely on their judgement about when the LED turns on. Further, infrared LEDs can be included in the measurement, and the experiment can be completed with turning out the room lights.
 Finally,
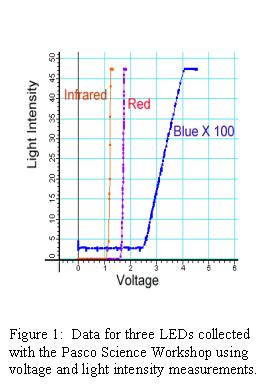
students can complete the experiment using computer-based measurement.
A light sensor is placed over the LED and a voltage measurement is taken
from the external output terminals. A graph of the voltage vs. light intensity
provides a clear indication of the behavior of an LED as a function of
voltage. Some sample data taken by a student are shown in Figure 1
Finally,
students can complete the experiment using computer-based measurement.
A light sensor is placed over the LED and a voltage measurement is taken
from the external output terminals. A graph of the voltage vs. light intensity
provides a clear indication of the behavior of an LED as a function of
voltage. Some sample data taken by a student are shown in Figure 1
The Device has been built with a large voltage display so that it is useable for a demonstration in a classroom. For medium sized classes the students can see the voltage reading and the LEDs directly. For larger classes a video camera and large screen projection will make the experiment visible. An instructor can also use the optics of an overhead projector (with the lamp turned off).
References