Apparatus Title: System to Measure Horsepower and Torque Curves of a Car
Abstract
A special sensor has been constructed to allow a laptop computer to measure the position and velocity of a car in real time. By flooring the car on a straight level road, it is possible to collect data which yield the horsepower and torque curves versus engine speed.
Sketch of the apparatus
A complete description of the apparatus is desirable, detailed enough that others can duplicate the apparatus. This description (anonymous) will be available to the judges of the apparatus. Samples of student reports (anonymous) may also help the judges to recognize the merits of this apparatus.
Description
 The
apparatus consists of a magnet, a standard magnetic probe, a special clamp,
a converter circuit, a standard sensor interface unit, and a laptop computer.
The
apparatus consists of a magnet, a standard magnetic probe, a special clamp,
a converter circuit, a standard sensor interface unit, and a laptop computer.
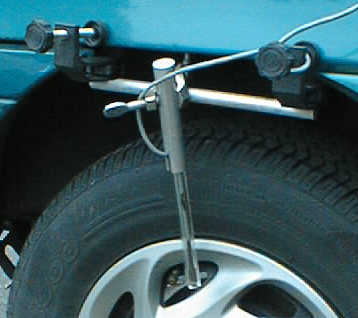
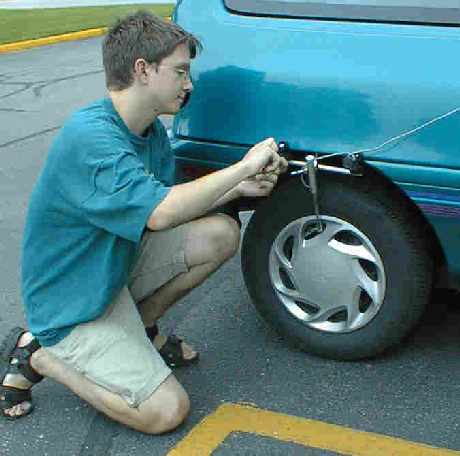
Above, a student is mounting the magnetic probe on a car. The clamp was designed to be able to be connected rapidly to almost any car. The magnet was a tiny neodymium magnet placed inside a brass valve stem cap. The probe was positioned so that the magnet passed within about 1 cm of it.
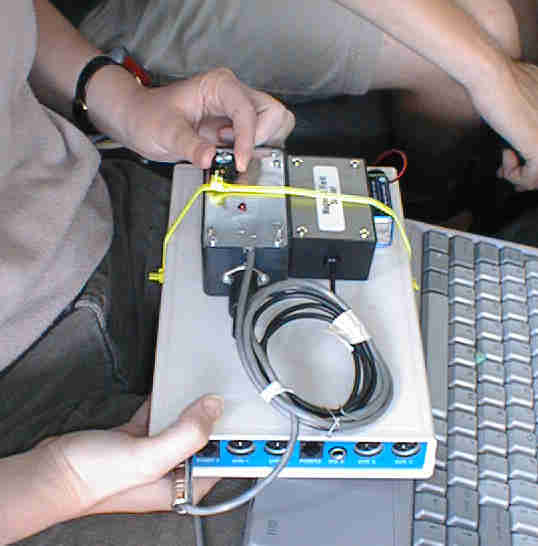
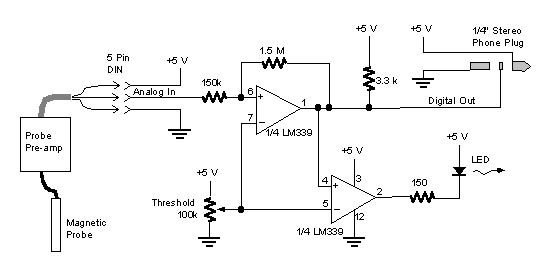
The probe creates a small peak in its output voltage when the magnet passes near it. For our system this was about 1 V in height above the baseline. To make data collection more straightforward, we designed a simple circuit to convert this signal into a digital signal similar to the type produced by digital pulleys. The probe is plugged into this circuit and then the circuit is connected to a digital port on the interface unit. It draws the 5V power from the interface unit.
The circuit employs an analog comparator to change the analog input into a digital output. The threshold is controlled by a potentiometer which the students adjust. There is a small amount of positive feedback to give it some hysteresis. The circuit also has an LED indicator which flashes with the digital output signal so that the students can easily adjust the threshold to the optimum level. The output of the conversion box is connected to the laptop computer though a standard laboratory interface (we used the ULI interface from Vernier powered by an external 9-volt battery). The interface software (Logger Pro) was set to treat the signal as if it were from a digital pulley.
Before heading out to the highway, students must determine the circumference of the wheel by rolling it through several revolutions and measuring the distance traveled on the pavement. They also visit a local gravel company which has a drive-on scale where they weigh the car and its occupants.
 The
Logger Pro software creates a live graph of the car's position, velocity,
and acceleration versus time while the car is in motion. Besides being
a wonderful pedagogical tool, it is immediately apparent if the system
is not working properly.
The
Logger Pro software creates a live graph of the car's position, velocity,
and acceleration versus time while the car is in motion. Besides being
a wonderful pedagogical tool, it is immediately apparent if the system
is not working properly.
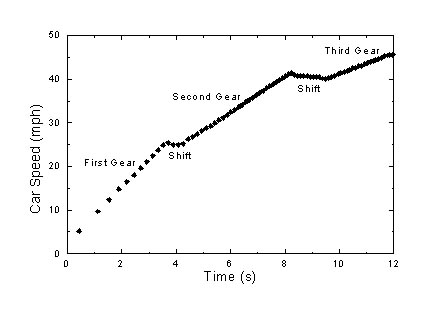
At left is an example plot like the kind that is seen live as the car is being driven. Here the car is accelerating through the first three gears. There is already much one can learn from this plot. The roughly constant acceleration within each gear is due to roughly constant engine torque. The slopes in the different gears differ because the gear ratio changes the effective torque on the wheels.
In order to collect data on the horsepower versus engine speed, students go to a long, straight road where there are no stops. They measure the wind speed and direction. Then they put the car in a gear and fully engage the clutch and drive at a very slow speed. After beginning data collection, the driver floors the car. The car is allowed to speed up to the speed limit or the engine redline speed, whichever comes first. Then they slow back down to crawl and repeat the routine in another gear. Finally, they do a coasting run to collect drag data. For this, they drive at the speed limit and then put the car in neutral and coast all the way down to a stop.
With very detailed instructions but no lab assistant along, nearly all student groups return with good data.
To extract the horsepower and torque curves from this data students make use of a rather elaborate excel spreadsheet program. While this is not the place to explain all its details, the basic calculation is as follows:
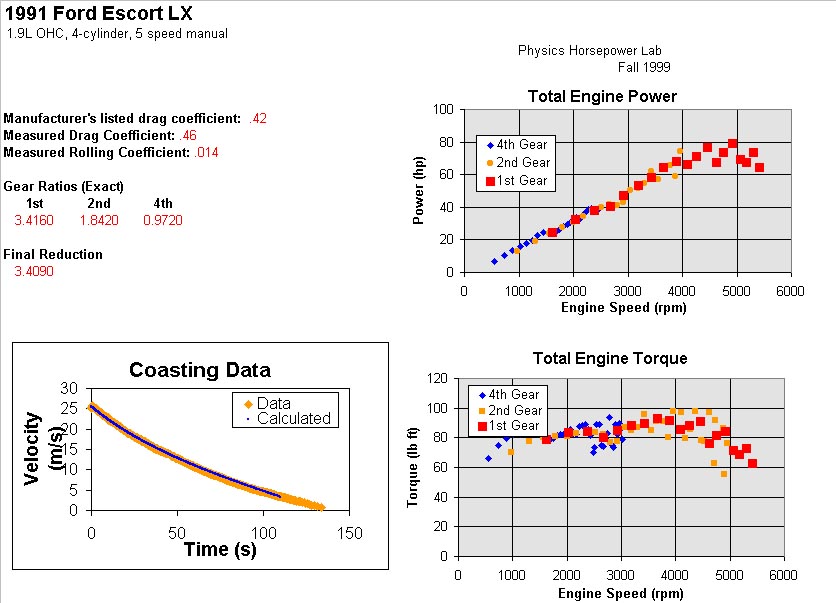
Student reports culminate in a one page summary showing the horepower and torque curves as well as drag data fitted to find the drag coefficients. Here is one of those reports: