SO 151
Bremmer
December 20, 1996

1st In-Class Exam

Part I. Multiple Choice (3 points each). Indicate the best answer for each question.
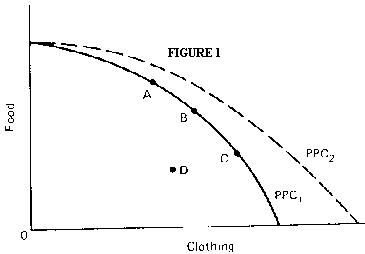
1. In Figure 1, PPC1 is the initial production possibilities curve. If the economy is originally at point D, then
A. the price of food is rising, relative to the price of clothing.
B. it would be possible to produce more food, but only if less clothing were produced.
C. it would be possible to produce more clothing, but only if less food were produced.
D. there is large-unemployment, and the economy could produce more of both food and clothing.

2. If production moves along PPC1 in Figure 1 from A to B to C, then:
A. the opportunity cost of clothing is rising.
B. the opportunity cost of food is rising.
C. there is technological improvement in the production of food, but not clothing.
D. there is technological improvement in the production of clothing, but not food.
3. If the production possibilities curve in Figure 1 moves out from PPC1 to PPC2, what is the most likely cause?
A. An increase in population, which makes possible an increase in total output.
B. A general technological improvement, in both food and clothing production.
C. A technological improvement in clothing production alone.
D. A technological improvement in food production alone.

4. The production possibilities curve normally bows outward, but it may be a straight line. Suppose that we put two goods, X and Y, on the two axes. The PPC will be a straight line if:
A. resources are specialized.
B. resources are not uniform in quality; some are better at producing one good than the other.
C. the resources used to produce X are equally well suited to produce Y.
D. Both A and B.

5. The demand curve for good X will shift to the left if:
A. the population increases.
B. income decreases, and X is a normal good.
C. the price of X increases.
D. the product has become more fashionable and desirable.

6. The supply curve of good X will shift to the right if:
A. the price of a key input decreases.
B. the number of firms decrease.
C. a per unit subsidy given to producers is removed.
D. the price of X increases.

7. Assuming upward sloping supply curves and downward sloping demand curves, you can unambiguously predict a decrease in equilibrium price if:
A. demand and supply both decrease.
B. demand and supply both increase.
C. demand increases and supply decreases.
D. demand decreases and supply increases.
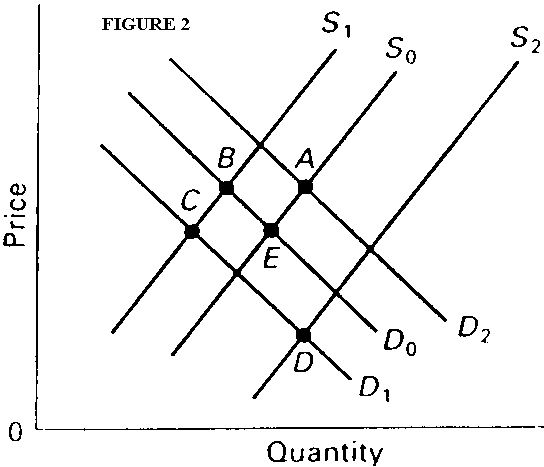
8. In Figure 2, the market for personal computers is initially in equilibrium at point E. If the Federal government levies an excise tax on personal computers, the market will move to what point?
A. A
B. B
C. C
D. D

9. Referring to Figure 2, if at the same time that the Federal excise tax is imposed, there is an increase in the prices of software used with personal computers, the market for personal computers will move to what point?
A. A
B. B
C. C
D. D
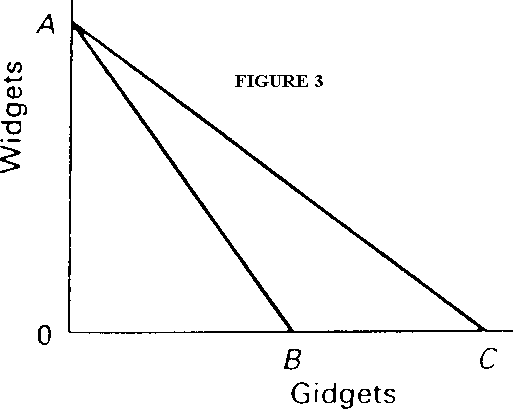
Answer the next two questions on the basis of Figure 3 in which line AB is the United States production possibilities curve and line AC is the U.S. after trade consumption possibilities curve.
10. We can conclude that the United States:
A. has decided to trade gidgets for widgets.
B. has a comparative advantage in gidgets.
C. has chosen to specialize in the production of gidgets.
D. has chosen to specialize in the production of widgets.

11. The international exchange ratio or terms of trade between gidgets and widgets:
A. cannot be determined on the basis of this information.
B. could lie anywhere between the slopes of lines AB and AC.
C. is the slope of line AC.
D. is the slope of line AB.
12. The demand for a commodity will tend to be less elastic if:
A. we are considering the long-run demand curve - - not the short-run demand curve.
B. the commodity is a small item in most buyers' budgets.
C. the commodity is a luxury item.
D. the commodity has several close substitutes.

13. A technological change that shifts the supply curve to the right will cause total revenue to:
A. rise if demand is elastic.
B. fall if demand is elastic.
C. rise if the price elasticity of demand is 1.
D. rise if demand is inelastic.

14. If the cross-price elasticity of demand between two goods is positive, we can deduce that the two goods are:
A. substitutes.
B. complements.
C. both normal goods.
D. both inferior goods.

15. Suppose the equilibrium price of a product is $5 and the government imposes a $1 per unit excise tax which causes the new equilibrium price to be $6. Which of the following is most likely to be true?
A. The product has a price elasticity of demand that is greater than 1.
B. The product has a demand curve that is perfectly elastic.
C. The product has a demand curve that is perfectly inelastic.
D. The product has a supply curve that is perfectly inelastic.

Part II. Short Answer (55 points). For each of the following questions give a short, concise, but complete answer. When appropriate, use graphs, math, or equations to help explain your answers.

1. Block's sells 500 bottles of perfume a month when the price is $7. A huge increase in resource costs causes the price to rise to $9 and Block's only manages to sell 460 bottles of perfume. Using the arc formula, calculate the price elasticity of demand. Is demand elastic, inelastic, or unitary elastic? (Show your work for partial credit.) (10 points)

2. Answer both of these questions regrading a production possibilities curve (PPC). (10 points)
A. List three factors that would cause an outward shift in the PPC. (No graphs or explanations are needed, just list the factors.)
B. True, false or uncertain: "A decline in unemployment will cause the production possibilities curve to shift outward." Briefly explain your answer.

3. Assume that both consumers and producers of good Y expect the price of Y to increase in the future. Using a demand and supply diagram, given these price expectations, what happens to the current equilibrium price of good Y? Explain. (10 points)

4. Apples and oranges are substitutes. A freeze in Florida destroys most of the orange crop. What happens in each of the following markets: (i) the orange market, (ii) the apple market, and (iii) the market for apple juice? For each market, use supply and demand diagrams to explain your answers. (105 points)

5. Answer the following questions on the basis of the following production possibilities curves for countries Alpha and Beta. All data are in tons.

Alpha's production possibilities:
A B C D E
Soup 60 45 30 15 0
Nuts 0 15 30 45 60
Beta's production possibilities:
A B C D E
Soup 20 15 10 5 0
Nuts 0 15 30 45 60

Which country has a comparative advantage in soup? in nuts? Explain. (Show your work for partial credit.) (10 points)