Part A. Multiple Choice (3 points each). Indicate the best answer for each question in the space
provided.
The next four questions refer to the following table for an economy that produces two products.
Production Possibilities Curve
Product
A
B
C
D
E
F
Tanks
0
1
2
3
4
5
Autos
1000
950
850
650
350
0
1. In moving from point C to point D, the cost of a tank in terms of autos is:
A. 50.
B. 100.
C. 200.
D. 300.
2. The opportunity cost of each additional tank in terms of autos:
A. remains constant.
B. falls as more tanks are produced.
C. increases as more tanks are produced.
D. cannot be measured.
3. According to the production possibilities schedule above, a combination of four tanks and 650 autos
is:
A. attainable, but it involves an inefficient use of society's resources.
B. attainable, but it would not be in the best interests of a strong national defense.
C. not attainable because it is not listed in the schedule.
D. not attainable because society does not sufficient resources to produce this combination.
4. Given the production possibilities curve above, a combination of three tanks and 350 autos:
A. illustrates the tradeoff between tanks and autos.
B. is attainable, but involves the unemployment or inefficient use of some of society's resources.
C. cannot be produced by society, given its current level of resources and production technology.
D. is not attainable because this combination is not listed in the schedule.
5. If resources are perfectly shiftable between the two products shown on a production possibilities
curve:
A. the production possibilities curve would be a concave curve that bows outward from the origin.
B. the production possibilities curve exhibits the law of increasing costs.
C. the production possibilities curve would be a straight line.
D. Both A and B.
6. Which of the following will cause the demand curve for product A to shift to the left?
A. An increase in the price of A.
B. An increase in income if A is a normal good.
C. Consumers expect the future price of A to fall.
D. Population growth which causes an expansion in the number of persons consuming A.
7. Which of the following will cause the supply curve for good X to shift to the left?
A. An improvement in the technology of producing X.
B. Firms expecting the future price of X to fall.
C. A decline in the price of a basic raw material used in the production of X.
D. A decrease in the number of firms producing X.
8. Assume upward sloping supply curves and downward sloping demand curves. You can
unambiguously predict an increase in equilibrium quantity if:
A. demand and supply both increase.
B. demand and supply both decrease.
C. demand decreases and supply increases.
D. demand increases and supply decreases.
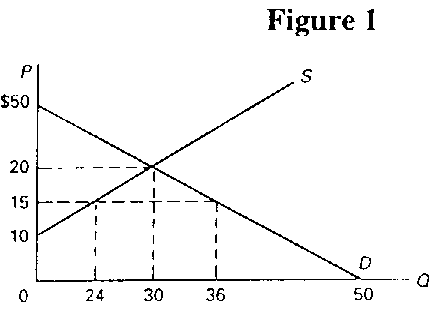
9. Consider the supply and demand curves in Figure 1. If the government established a price ceiling
of $15, the total revenue received by suppliers would:
A. fall by $5.
B. fall by $30.
C. fall by $120.
D. fall by $240.
10. Given that pretzels and beer are complementary goods and the price of beer rises, which of the
following will occur?A. The equilibrium price and quantity of pretzels will both rise.
B. The equilibrium price of pretzels will rise, and the equilibrium quantity will fall.
C. The equilibrium price of pretzels will fall, and the equilibrium quantity will rise.
D. The equilibrium price and quantity of pretzels will both fall.
11. When the price of a product is below its equilibrium level, a:
A. surplus puts upward pressure on the price.
B. surplus puts downward pressure on the price.
C. shortage puts upward pressure on the price.
D. shortage puts downward pressure on the price.
12. An inferior good is best defined as a product for which the:
A. cross price elasticity of demand is negative.
B. income elasticity of demand is negative.
C. cross price elasticity of demand is positive.
D. income elasticity of demand is positive.
13. Which of the following will cause a demand curve to be relatively elastic?
A. There are few substitutes.
B. The good is considered to be a necessity.
C. The demand curve pertains to the long run rather than the short run.
D. Purchases of the good require a small portion of consumers' budgets.
14. If in the short run the demand for mass transit is inelastic and in the long run the demand is
elastic, then a price:
A. increase will decrease total revenue in the short run but increase total revenue in the long run.
B. decrease will increase total revenue in the short run but decrease total revenue in the long run.
C. decrease will decrease total revenue in the short run and decrease total revenue in the long run.
D. increase will increase total revenue in the short run but decrease total revenue in the long run.
15. A straight-line, downward-sloping demand curve has a price elasticity of demand which:
A. decreases as price decreases.
B. increases as price decreases.
C. is zero at all prices.
D. is equal to one at all prices.
Part B. Short Answer (55 points). Give a complete, but concise answer for each of the following
questions. Use complete sentences when asked to explain an answer. When appropriate, use graphs,
math, or equations to help explain your answers. Label all axes and curves.
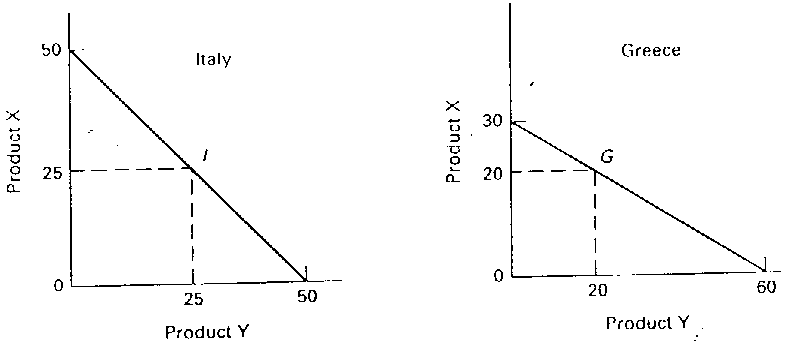
1. The graph below shows the hypothetical production possibilities curve for Italy and Greece, which
each make two products, product X and product Y. Define what is meant by comparative advantage.
In what products to these countries have a comparative advantage? Explain and show your work. (15
points)
2. Answer the following questions. If your graph is self-explanatory, no other discussion is necessary.(10 points) A. Draw a production possibilities curve (PPC) for a country that produces beer and pretzels and
exhibits the law of increasing cost. Label this curve PPC1.
B. Now show how the PPC would change if there has been a technological advance that facilitates
more efficient production of both goods. Label that curve PPC2.
C. Returning to the original production possibilities curve, what would happen to the PPC if there was
a technological advance that only aided beer production? Label the new curve PPC3.
3. A gasoline station very near a professional football stadium parks cars on its lot to make money on
game days. Last it charge $4.00 per car and parked 1,000 cars. This year it raised the parking price to
$5.00 and parked 850 cars. Using this data, calculate the price elasticity of demand using the arc
formula (show your work for partial credit). In this price range, is demand elastic, inelastic, or unitary
elastic? Did the station owners make a good decision in raising the parking prices from one period to
the next? Explain. A graph isn't necessary, just provide the derivation and explanation.(10 points)
4. Suppose the government has established an effective price floor for corn. Now assume that a severe
drought has destroyed a significant portion of this year's crop. Would there still be the surplus
commonly associated with a price support? What happens to the farmers' revenue from the
government? Explain. Both a demand and supply graph and an explanation are required.(10
points)
5. Assume goods X and Y are substitutes. Suppose the government gives the producers of X a $5 per
unit subsidy. Using demand and supply diagrams, explain how this subsidy affects the market for X
and the market for Y. An explanation and graphs are both required.(10 points)