SL 151
Bremmer II
April 21, 2000
2nd In-Class Exam - - Chapters 7-9, 13-14
Part I: Multiple Choice (3 points each). For each of the following
questions, indicate the best answer.
Questions 1 - 3 refer to Figure 1 which represents a constant-cost,
perfectly competitive industry and a firm in the industry.
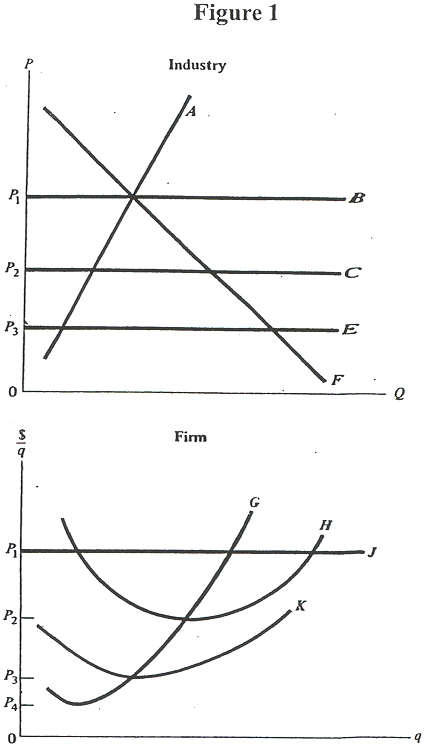
- According to Figure 1, in the long run:
there will be no entry or exit of firms in this industry.
firms will enter and curve F shifts to the right.
firms will exit and curve F shifts to the left.
firms will exit and curve A shifts to the left.
firms will enter and curve A shifts to the right.
- In Figure 1, long-run equilibrium in the industry will be reached
at a price of:
P1
P2.
P3.
P4.
- Referring to Figure 1, the industry's long-run supply curve is:
curve A.
curve F.
curve B.
curve C.
curve E.
- If the government impose a $100 lump-sum tax on a firm:
its ATC, AFC, and MC curves shift upwards, but its AVC curve
is unaffected.
its ATC, AVC, and MC curves shift upwards, but its AFC curve
is unaffected.
its ATC and AFC curves shift upwards, but its MC and AVC
curves are unaffected.
its ATC and AFC curves shifts downwards, but its MC and AVC
curves are unaffected.
its ATC, AVC, and MC curves shifts downwards, but its AFC
curve is unaffected.
- Assume a firm's labor union agrees to a wage cut. Then the
firm's:
ATC, AFC, and MC curves will shift downwards, but its AVC
curve is unaffected.
ATC and AVC curves will shift downwards, but its AFC and
MC curves are unaffected.
ATC and MC curves will shift downwards, but its AFC and AVC
curves are unaffected.
ATC and AFC curves shifts downwards, but its MC and AVC curves
are unaffected.
ATC, AVC, and MC curves shifts downwards, but its AFC curve
is unaffected.
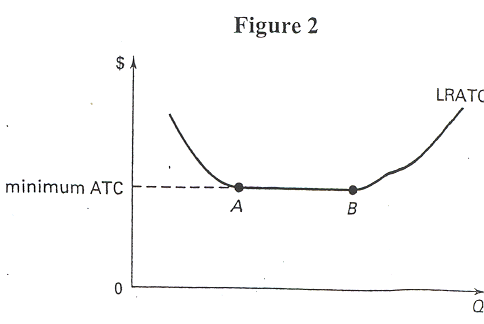
- In Figure 2, the long-run average total cost curve (LRATC) indicates
that there are diseconomies of scale:
between points A and B.
at points A and B.
to the left of point B.
to the right of point B.
to the left of point A.
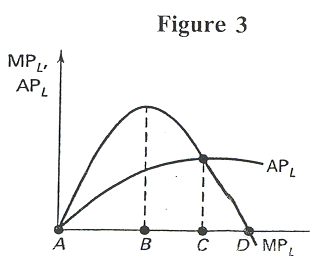
- In Figure 3, what level of labor usage maximizes output?
A.
B.
C.
D.
Can't tell with the information given.
- In Figure 3, at what level of labor does diminishing returns sets
in?
A.
B.
C.
D.
Can't tell with the information given.
- In Figure 3, when is AVC rising?
Only between A and B.
Only between A and C.
To the right of point C.
Only between B and D.
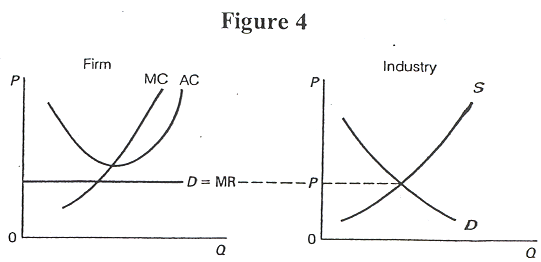
- Assume Figure 4 shows a perfectly competitive, increasing-cost
industry in short run equilibrium (Note: AC = ATC). What will happen
in this industry in the long-run?
Firms will enter and S will shift to the right.
Firms will exit and S will shift to the left.
The MC and the ATC curves will shift down.
A and C.
B and C.
- When marginal cost is increasing:
average variable cost must be increasing.
average total cost must be increasing.
total cost is increasing.
average fixed cost is increasing.
marginal product is increasing.
- Given a normal, upward-sloping supply curve, suppose that the
demand for French bread decreases. What will happen to producer surplus
in the market for French bread?
It increases.
It decreases.
It is unaffected by this change in demand.
It decreases briefly, then increases.
Figure 5 shows the before-trade and after-trade position of Spain
in the oil market.
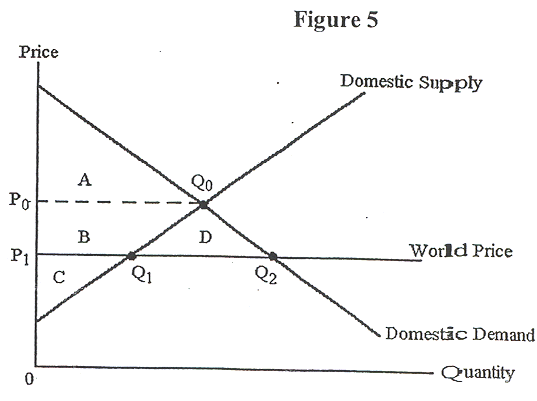
- According to Figure 5, before trade, consumer surplus in Spain
was:
C.
C + B.
A + B.
A + B + C.
A.
- In Figure 5, after trade, producer surplus falls from ____ to
____ .
A + B + C; C
A + B + C; B + C
C + B + D; C + B
C + B; C
C + B + D; C
- Given the information in Figure 5, after trade, society welfare
___ by ___ .
increases; B + D
increases; D
decreases; B
increases; A + B + D + C
decreases; C
Part II. Short-Answer Questions (55 points). Give a concise,
but complete answer for each of the following questions. When appropriate,
use math, graphs, or equations to help explain your answers.
- Suppose a firm has the short-run production function listed below.
Calculate the average product and the marginal product for this production
data. Do you feel such a short-run production is plausible? Why or why
not? (10 points)
| Q |
0 |
30 |
60 |
90 |
120 |
150 |
180 |
210 |
240 |
270 |
| L |
0 |
10 |
20 |
30 |
40 |
50 |
60 |
70 |
80 |
90 |
| AP |
|
|
|
|
|
|
|
|
|
|
| MP |
|
|
|
|
|
|
|
|
|
|
- "A perfectly competitive firm will never operate in the short-run
at an output where its average total cost curve is downward sloping." True
or false? Explain.
(10 points)
- Describe how the long-run average cost curve is derived. Why does
a firm need to know its long-run average cost curve? Explain which plants
would be used over- and under- capacity. Identify the optimal sized plant
and tell why its optimal. (15 points)
- Starting from long-run equilibrium, trace the short-run and long-run
effects of a decrease in demand for a perfectly competitive, constant-cost
industry. (10 points)
- Assume a market has a downward-sloping demand curve and an upward-sloping
supply curve. Using a demand and supply diagram, illustrate and explain
what happens to consumer surplus, producer surplus, and society welfare
after the imposition of a $1 excise tax on producers. (10 points)