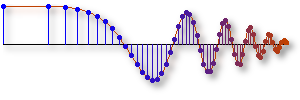
Beat Notes reproduces the following figures.
Do this:
Figure 3-3
- Set Fc to 200, Delf to 20 and both Amplitude A and
Amplitude B to 1.
- Set Plot Time to 100m.
- You now see Figure 3-3. Where are the nulls?
- Click Play as Sound.
Figure 3-4
- Adjust Delf to 9 Hz.
- What happens to the plot? Where are the nulls?
- Listen to it. How does its sound compare to Figure 3-3's?
- Click Play an Example. Adjust the parameters so your sound sound's like the example.
Figure 3-5
- Adjust Delf, Amplitude A and Amplitude B to get Figure 3-5.
- Hint: A and B will have different amplitudes.
Figure 3-6
- You should be able to figure out this one.

Sorry, but the Linux platform is not supported at this time.
LabVIEW Tips and Troubleshooting (LV2010 Mozilla an unknown version Linux undefined)source
Sorry, but the Linux platform is not supported at this time.
LabVIEW Tips and Troubleshooting (LV8.6 Mozilla an unknown version Linux undefined)source