Clay Whistle Demo
This demo illustrates that (nearly) sinusoidal signals
can be produced by other simple physical systems.
In this case, we use a simple clay whistle which
can be modeled as a an "acoustic tube" or a closed-end pipe.
The objective of the demo is to listen to the
sounds of two different clay whistles and then compute the frequencies
of the sinusoids from a plot.
|
CLAY WHISTLE: BLUE-BIRD
This clay whistle emits a nearly sinusoidal signal when you blow it. Can you determine the frequency of the sinusoidal signal that is produced by the whistle? |
SOUND |
|
CLAY WHISTLE: CAT
This clay whistle also emits a nearly sinusoidal signal when you blow it. The frequency should sound higher. Once again, you should determine the frequency of the sinusoid (see the plots below). |
SOUND |
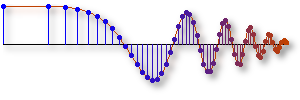
BLUE-BIRD/CAT WHISTLE: Here is a plot of part of the sound from the blue-bird and cat clay whistles.
Select which whistle you want to see and hear and click on the run button to play the sound.
You can zoom around the plot, or click a different tab to see another view.
What is the frequency of the whistle?
You can compute it by measuring the period be zooming in on the plot above.
ANSWER for the frequency of the Blue-Bird.
ANSWER for the frequency of the Cat.