CSSE 220: Object-Oriented Software Development
Plotter

You will do this exercise by yourself, but be quick to ask questions of your instructor, student assistants and classmates as desired.

Goals

This exercise will let you:

  • Practice designing classes by developing a UML class diagram

  • Combine and apply concepts that you have practiced in previous exercies, especially how to:

    • Implement a class
      • Fields, constructors, methods.
      • Constructing objects by using the new keyword
      • Referencing instance fields and methods by using the this keyword
      • Implementing an interface
    • Create a basic GUI (Graphics User Interface) and draw on it.
      • The JFrame and JComponent classes; the add method of the former and the paintComponent method of the latter.
    • Investigate and apply an API (Application Programming Interface). In particular, the use of these classes:
      • JFrame and JComponent
      • Graphics2D
      • Line2D.Double
      • Color
  • Implement a project as both an Application and an Applet (and see how easy that is)

Grading rubric

  • Stage 1 works as specified: 5 points.
  • Stage 2 works as specified: 10 points.
  • `
  • Stage 3 works as specified: 10 points.
  • Stage 4 works as specified: 15 points.
  • Stage 5 works as specified: 10 points.
Total possible: 50 points.

Do this project using documented stubs throughout.

  • Your score may be reduced by as much as 40% for each stage that is missing documentation.

Use good style throughout.

  • Your score may be reduced by as much as 40% for each stage that uses poor style.
  • Exception: it is OK to have magic numbers in your code that tests drawing Plot's.
  • Control-shift-F is helpful to format the file you are working on!

For any points deducted, the grader will put a CONSIDER tag saying how many points were deducted and why.

“Earn back” may be available for this assignment; ask your instructor.

  • Students: “earn back” is a privilege — don't abuse it. Put forth your “good faith” effort on the project and reserve earn-back for errors that you did not anticipate.

Here is a link to the General Instructions for Grading Programs.

Overview

You will implement this project in stages, testing at each stage to see if the project works correctly through that stage.

  1. Read these stages of the iterative enhancement plan (but DON'T DO THEM yet — detailed instructions follow):

Implement the project

Implement according to the following Iterative Enhancement Plan (IEP):

Stage 0. Read the specification, then design the project using a UML class diagram

Here is a specification of this project:

  • A Plot has a:
    • Function that gets plotted
    • X-coordinate of the center of the plot area
    • Y-coordinate of the center of the plot area
    • drawOn method that displays the plot
  • A Function is a real-valued function of one variable and has:
    • A valueAt method that specifies the function; it takes a double and returns a double
  • A CubicPolynomial is a Function that implements a cubic polynomial: a x3 + b x2 + c x + d
  • A PlotterComponent class tests the drawing that a Plot object performs on its Function
    • By producing something like the picture to the right

  • A PlotterFrame class constructs and displays a PlotterComponent in a JFrame
  • A PlotterApplet class constructs and displays a PlotterComponent in a JApplet

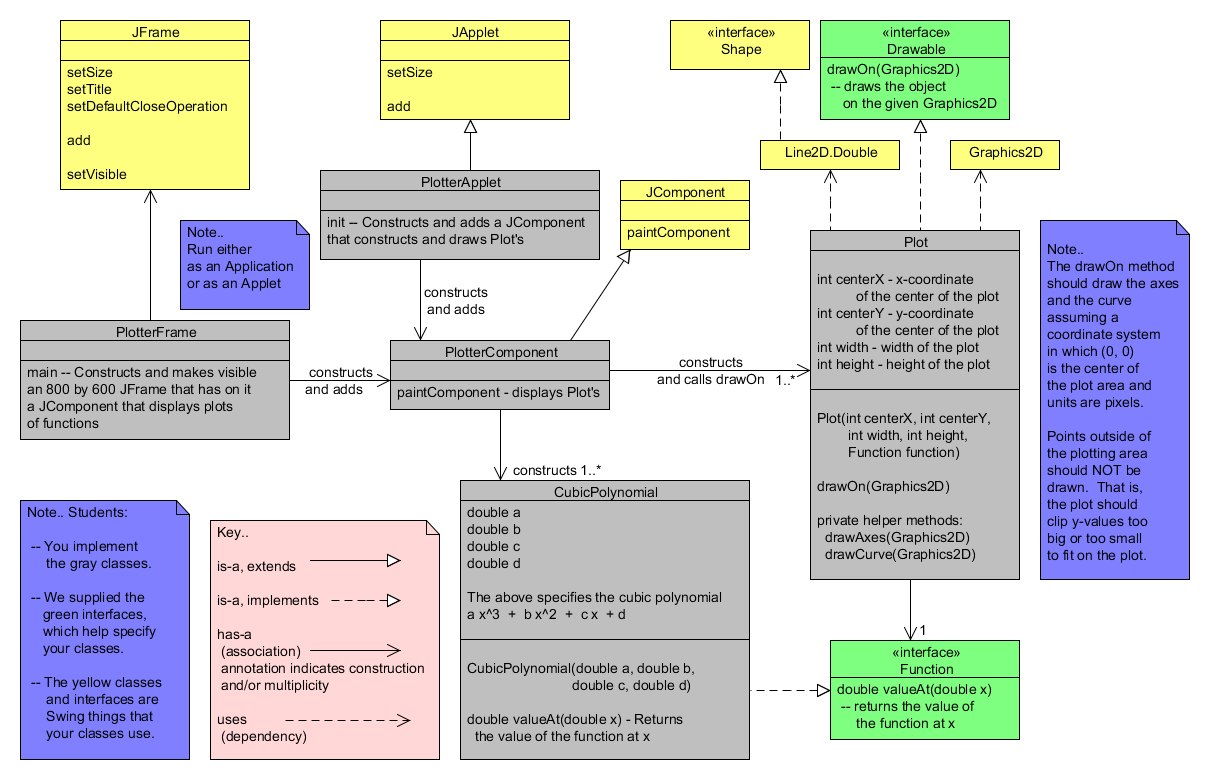
Here is the UML class diagram for the Plotter project that we developed together in class.

The Plotter project when finished - a cubic polynomial is displayed

Stage 1. An empty 800 x 600 frame appears

  1. Open Eclipse.
  2. From your individual repository, checkout the Java project called Plotter
    • Use the SVN Repositories view to check out this project.

  3. Create a new class called PlotterFrame with the usual main method.
    • As usual, let Eclipse type a stub for main for you.
  4. Write documented stubs for PlottterFrame and its main method.
    • Your documentation should include words like
      Constructs and makes visible an 800 by 600 JFrame that has on it JComponent's that display plots of real-valued functions of one variable.
Stage 1: Frame appears

  1. Implement and test your documented stubs.
    • Test by seeing if the JFrame appears with the right size and an appropriate title (per the picture to the right), and that closing the JFrame exits the application.
    • Refer to Stage 1 of the SwingDemo1 instructions if you need reminders for how to accomplish this stage.
    • The UML for this stage of the project is shown to the right.
  2. Commit your work.
    • As usual, continue to do frequent commits throughout this project.
Stage 2: UML for PlotterFrame

Stage 2. The CubicPolynomial class passes JUnit tests

In this stage you will implement a CubicPolynomial class that represents a real-valued polynomial of degree 3. Here you will test the class in isolation; in the next stage, you will integrate it with the JFrame and other graphics components.

  1. Create a new class called CubicPolynomial.
    • It should not have a main method; instead, you will use JUnit tests to test your CubicPolynomial.
  2. Implement CubicPolynomial per the UML class diagram shown to the right.

    • The class diagram shown is part of the class diagram that you developed in class for the entire project.
    • We supplied the Function interface.
    • As usual, let Eclipse add the unimplemented methods via Quick Fix, once you tell Eclipse that CubicPolynomial implements Function.
    • Write documented stubs first, then implement the class.
      • For the class, you might say something like:
        A CubicPolynomial is a real-valued cubic function of one variable; that is, a polynomial of degree 3.
      • For the function method, you might say something like:
        Returns the value of this cubic polynomial at the given x.
    • We supplied JUnit tests in a class called CubicPolynomialTest.

      Run the tests, correcting errors as needed, until you are convinced that your CubicPolynomial class is correct.

Stage 2: UML for CubicPolynomial

Stage 3. The axes appear

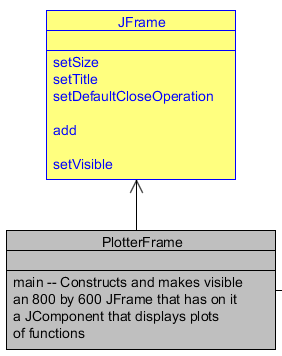
Recall that you don't normally draw directly onto a JFrame. Instead, you:

  • Implement a class that extends JComponent (or a special type of JComponent like JLabel, JPanel or JButton).
  • Construct an instance of your class and add that instance to your JFrame.
  • Override the paintComponent(Graphics) method of your class that extends JComponent, putting the drawing statements in your method that overrides paintComponent.

Proceed as follows:

  1. Implement the rest of the UML class diagram for the Plotter project that we developed together in class, EXCEPT:

    • Don't implement the PlotterApplet class yet.
    • For now, don't draw the Function in drawOn (you'll do that in the next stage); just draw the axes.

    Important: Your first statement in drawOn(Graphics2D graphics2) in the Plot class should translate the coordinate system so that (0, 0) is the center of the Plot, like this:

        graphics2.translate(this.centerX, this.centerY);
    
    (but using your own variable names, of course), and your last statement in drawOn(Graphics2D graphics2) should undo that translation, like this:
        graphics2.translate(-this.centerX, -this.centerY);
    
    In the description that follows, I'll assume that you made this translation of the coordinate system.

    Test your code by:

    • In PlotterComponent's constructor, construct several Plot's (at different positions with different sizes).
    • In PlotterComponent's paintComponent, ask each of the constructed Plot's to run their drawOn method.
    • Suggestion: Here is the code that I used to make the picture to the right; feel free to copy-and-paste it.
          Plot plot;
          
          plot = new Plot(220, 270, 400, 500, null);
          plot.drawOn(graphics2);
      		
          plot = new Plot(625, 150, 250, 250, null);
          plot.drawOn(graphics2);
      		
          plot = new Plot(600, 450, 200, 200, null);
          plot.drawOn(graphics2);
      
      • It is OK if you use magic numbers for the positions and sizes of these test Plot's.
      • I used null as the argument for the Function because this stage does not use the Function; it just draws the axes.

    At the end of this stage, your project might look like the diagram to the right.

    Refer to Stage 2 of the SwingDemo1 instructions if you need reminders for how to accomplish this stage.

Stage 3: Axes appear on the frame

Stage 4. Curves appear

  1. Make the drawOn method in Plot draw its function, as follows:

    • Use a loop to calculate the y value for each integer x from -width / 2 to width / 2, where width is the width of the Plot being plotted.
      • Note that this assumes that you made the translation of the coordinate system that makes (0, 0) be the center of the Plot being plotted.

    • Use the Function's valueAt method to compute the y values.
      • Because it is a Function, it must have a valueAt method! Do you see the value of using an interface here?
    • Inside the loop, plot each portion of the graph by drawing a line from the previous point calculated to the next point. (You’ll have to calculate the first point outside the loop.)
      • The best solutions will call the Function's valueAt method only once (not twice) for each x-value.
    • Be sure to“flip” the y values when plotting so that the y-axis increases up the screen (despite the native graphics y-axis going down the screen).
    • Test your code by:

      • In PlotterComponent's constructor, construct several Plot's (at different positions with different sizes).
      • In PlotterComponent's paintComponent, ask each of the constructed Plot's to run their drawOn method.
      • Suggestion: Here is the code that I used to make the picture to the right; feel free to copy-and-paste it.
            Function cubic;
            Plot plot;
            
            cubic = new CubicPolynomial(0.00002, 0.01, 1.0, -40.0);
            plot = new Plot(220, 270, 400, 500, cubic);
            plot.drawOn(graphics2);
        		
            cubic = new CubicPolynomial(-0.0002, 0.0001, 1.0, -40.0);
            plot = new Plot(625, 150, 250, 250, cubic);
            plot.drawOn(graphics2);
        		
            cubic = new CubicPolynomial(0, 0, 1, 0);
            plot = new Plot(600, 450, 200, 200, cubic);
            plot.drawOn(graphics2);
        
        • It is OK if you use magic numbers for the positions and sizes of these test Plot's.
Stage 4: Curves appear on the frame

Stage 5. Can run as an applet

  1. Implement PlotterApplet, by following the example in the code that you were given for the Faces project.
    • The pictures to the right show the UML for this stage and the output after this stage is completed.
UML for PlotterApplet Stage 5: Project appears in an applet

Commit your work

  1. Commit your project to your individual repository when you are done.