Lab 3. Stack/Procedure Call
For the activities in this lab, first launch your Linux.
Perform a git pull on your repository to make sure it is up to date. Also,
print the Question Sheet in hard copy.
Get Lab 3 on your VM and keep your work in Git
Your VM is the Linux computer where you compile and run this lab. Your Gitter
repository is the shared copy that moves your work between the VM and your own
computer. Do not copy the lab3 directory manually between computers: commit
and push from one clone, then pull in the other clone.
On your own computer, connect to the VM you claimed (replace
XXwith its two-digit number):ssh csse@csse132-XX.csse.rose-hulman.eduOn the VM, clone your repository once if you have not done so already. Use your Rose username in both places:
git clone ssh://YOUR_ROSE_USERNAME@gitter.csse.rose-hulman.edu:13022/repos/2627a-csse132-YOUR_ROSE_USERNAME
cd 2627a-csse132-YOUR_ROSE_USERNAME
If you already cloned it on the VM, enter that directory instead.
Before starting Lab 3, update the VM copy:
git status
git pull
cd lab3
git statusshould say that there are no uncommitted changes before you pull. If it does not, commit your earlier work first or ask for help.Do the lab on the VM. When you want to save or transfer your work, return to the repository root and push it:
cd ..
git add lab3
git commit -m "Complete Lab 3 work"
git push
On your personal computer, open the separate clone of the same repository (or clone it there once with the command in Step 2) and run:
git pullYour pushed VM work will now appear locally. Likewise, after committing and pushing from your personal computer, run
git pullon the VM before continuing there.
After this lab, you will learn:
- The basics of using GDB to debug.
- How procedure calls (i.e., function calls) are implemented in programs. When one function (the caller) calls another function (the callee), we will discuss
- How local variables are stored/organized.
- How input arguments are passed from the caller to the callee.
- How a return value is passed from the callee back to the caller.
- How, when the callee finishes, the program control returns to the right place in the caller's code.
Answer the questions in the Question Sheet as you go through the lab!
Part 1. Examine Program with GDB
Install GEF (GDB Enhanced Features)
GEF (pronounced ʤɛf - "Jeff") is the old school GDB (GNU debugger) but with fancy features. To install GEF,
- Go to the
lab3folder. - Run the command:
sh setup_gef.sh - Install
gdbby runningsudo apt update && sudo apt -y install gdb
Understand the GEF Interface
Once the installation finishes, you can go to lab3/part1 folder. Then type
vim part1.c and read the source code to understand the functions in
the code.
Quit vim and return to the terminal. First, run the following command to compile the code.
gcc -g -fomit-frame-pointer part1.c -o part1
The -g flag tells the compiler to provide hints to GDB about how the C code corresponds to the
Assembly code. You should use that flag when debugging.
The -fomit-frame-pointer option is not required, but it simplifies the Assembly code.
Then, debug your compiled code by running
gdb ./part1
This should start GDB. But your code is not running yet. Then type
start
To tell GDB to run the program (this is a macro for
creating a breakpoint at the beginning of main with b main followed by run).
If this is successful, you should be able to see some colorful output similar to the screenshot shown below:
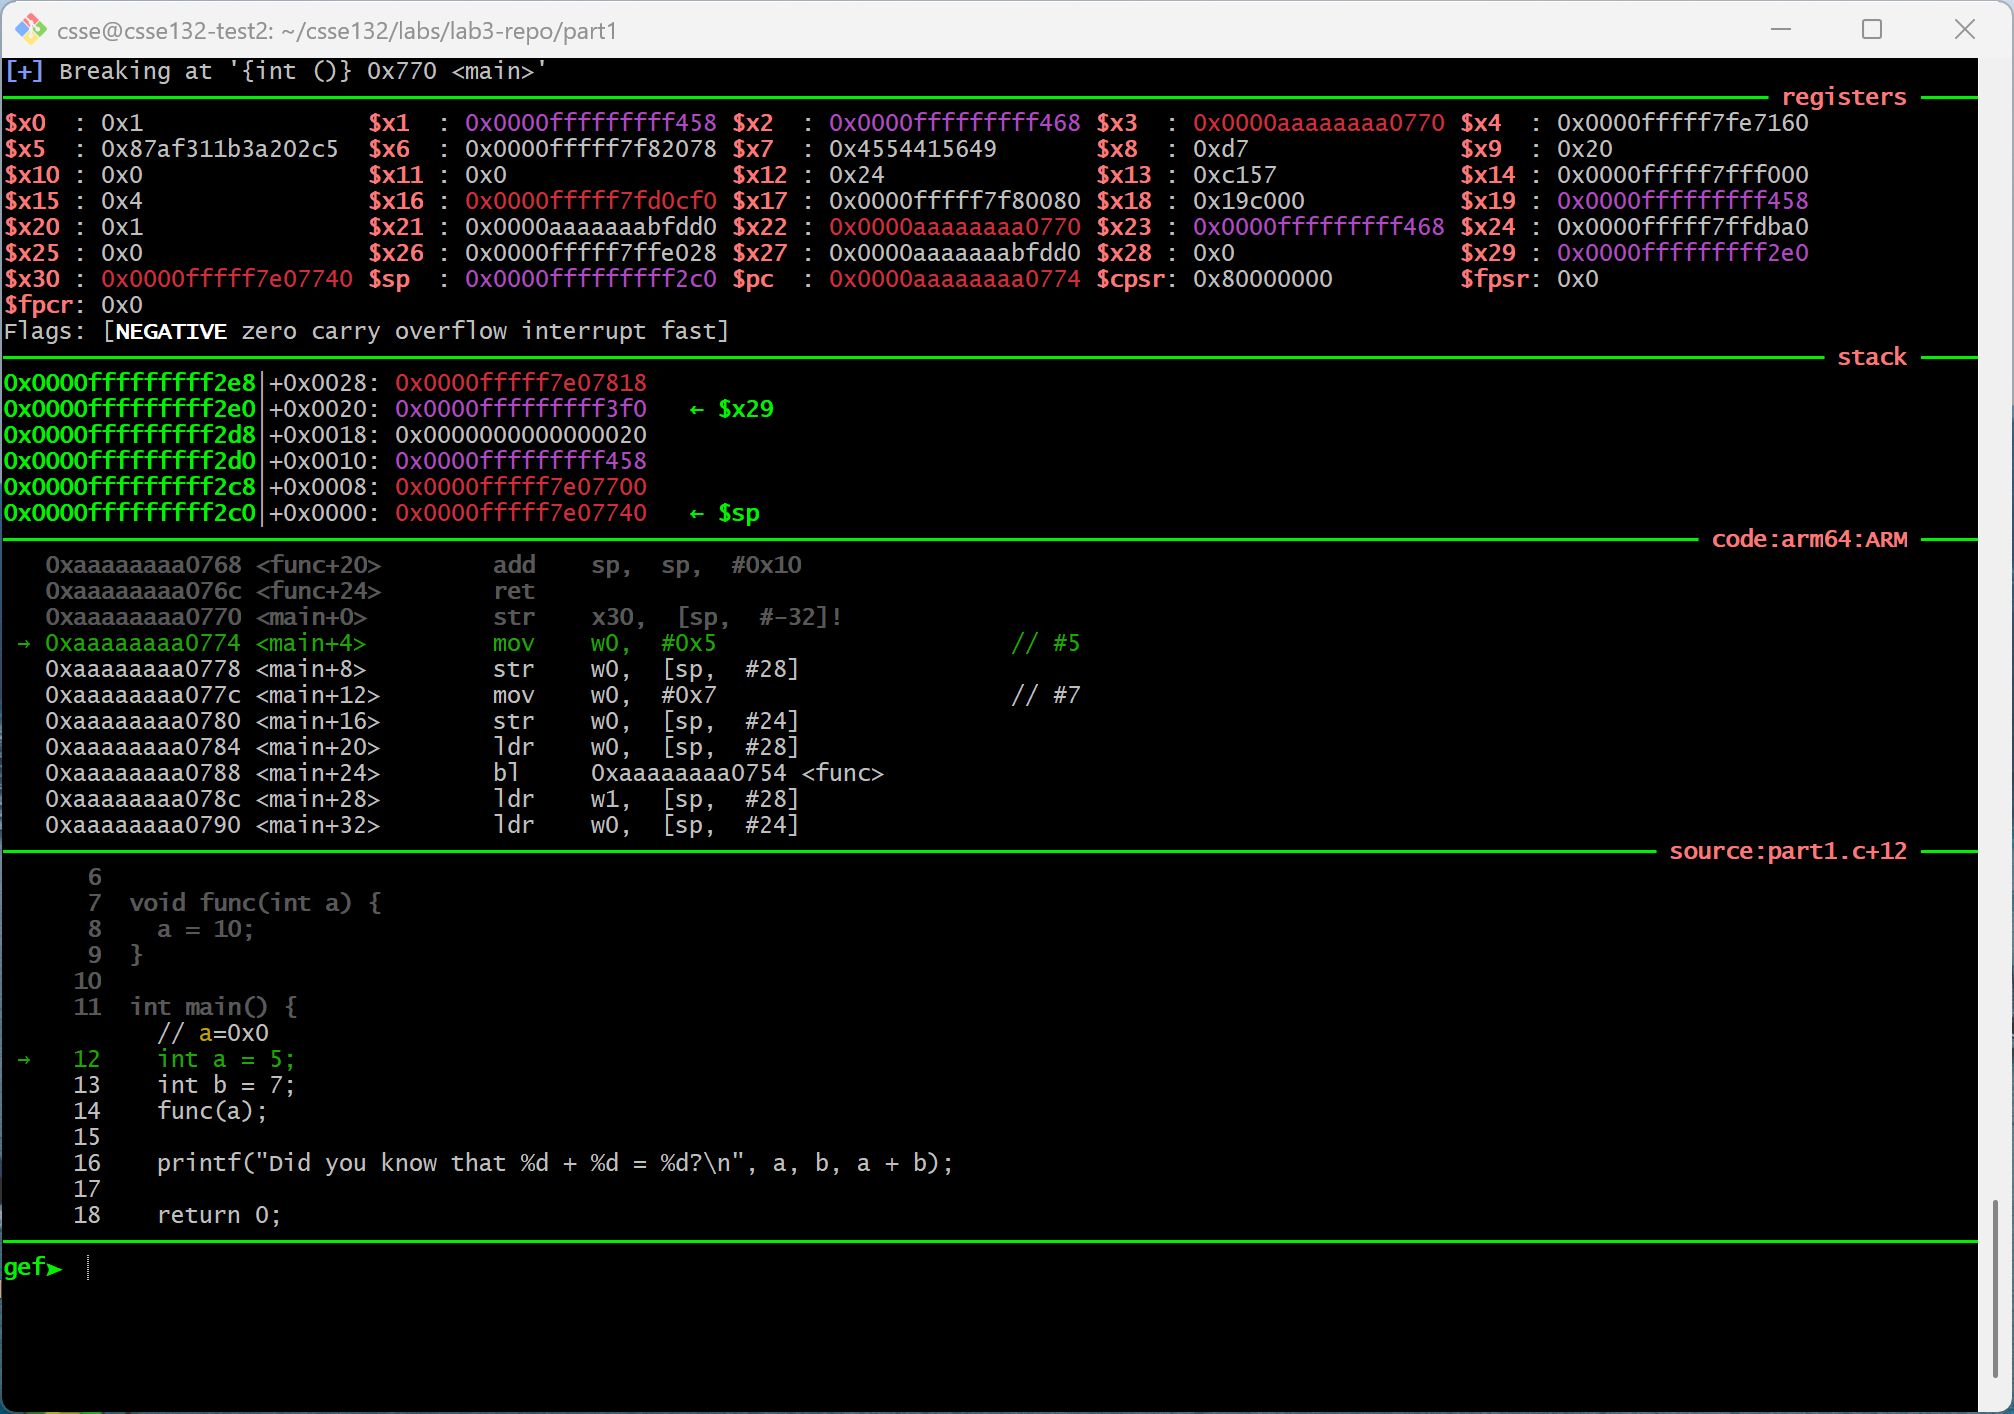
From top to bottom, you should see the four panels which show 1) registers, 2) stack, 3) ARM code and 4) C code. These panels reflect the current state of the machine, and will be automatically updated as we step through the code.
Stack Panel
The stack is the space in main memory that stores information for function calls,
including local variables, input arguments, etc. As shown in the picture below,
GEF labels two kinds of addresses for data stored on the stack.

All addresses are in hexadecimal. The absolute address is the address of the
data in the entire memory space. The relative address is the address with
respect to the value $sp in the stack pointer register. For example, a relative address
0x0004 means the address is $sp + 4.
Reading 4-byte data addresses on the stack: Each row in the stack panel shows 8 bytes of data. For 4-byte data variables, two variables are stored in one row. The addresses of the two variables can be illustrated as follows:
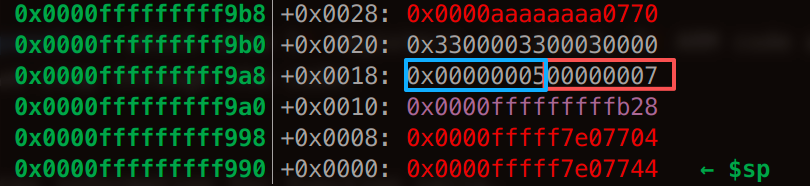
In this example, the two integer variables with values 5 and 7 are stored at the row with absolute address 0x0000fffffffff9a8 and relative address 0x0018. In each row, the right half (4 bytes) has the lower address, and the left half (4 bytes) has the higher address. Therefore, the variable with value 7 (labelled in the red rectangle) is stored at absolute address 0x0000fffffffff9a8 (relative address 0x0018), and the variable with value 5 (labelled in the blue rectangle) is stored at absolute address 0x0000fffffffff9a8 + 4 = 0x0000fffffffff9ac (relative address 0x0018 + 4 = 0x001c).
ARM Panel
The ARM panel shows the Assembly code for the program.

The Assembly code corresponds to bytecode (machine instructions) stored in the memory space. Therefore, each ARM instruction has a memory address. The green arrow indicates the current line that is about to run but not running yet.
Source Code Panel
This panel shows the C code of the program. You can see the line number of the code. Also, similar to the ARM panel, the green arrow indicates the current line that is about to run but not running yet.
Debug with GEF/GDB
Once the program is running in gdb, we can use various commands to debug the code.
Check this GDB Quick Reference for usages/instructions of various GDB commands.
- list breakpoints (
info breakori b) - set breakpoints (
b mainorb filename.c:line) - run the program again once breakpoints are set (
run) In this lab, you don't need this command as my script will automatically run the program for you. - stepping through C code (
next,n,step,s).nextacts like Eclipse's "step over".stepacts like Eclipse's "step into". Check GDB Quick Reference for detailed instructions. - running between breakpoints (
continue,c) - examine a variable
lenusing print:print len - examine register
x0using print:print $x0 - exit gdb (
quit)
Try out these commands and answer the questions on the Question Sheet in Part1.
Part 2: Stack/Procedure Call: Local Variables
The goal of this part of the lab is to discover how each function's local variables are organized.
cdinto thelab3/part2directory.- Open the
do_nothing.cfile usingvim. - Pay attention to the values of the local variable
aandbin bothmainanddo_nothingfunction. They have the same variable names but with different values. How? Let's find out. - Type
make do_nothing.sto generate the Assembly code. Open thedo_nothing.sfile usingvim. Skim through the code to get a rough idea of how the Assembly stores variables in memory space. - Type
maketo compile the program to executabledo_nothing. Start debugging withgdb ./do_nothing. Set break points in the following places:
There are questions you need to answer on the Question Sheet for EACH of the break points below. Please complete all questions for a break point before running to the next break point in GDB.
- The beginning of
main: Line 9 - After assigning
a,binmain: Line 11 - The beginning of
do_nothing: Line 4 - The end of
do_nothing: Line 6 - The end of
main: Line 12
- The beginning of
Debug the code and answer the questions on the Question Sheet in Part 2.
Part 3: Stack/Procedure Call: Function Input Arguments
The goal of this part of the lab is to discover input arguments are passed to functions.
cdinto thelab3/part3directory.- Open the
add.cfile usingvim. - Pay attention to the values of the input arguments
aandbofaddfunction passed frommain. - Type
make add.sto generate the Assembly code. Open theadd.sfile usingvim. Skim through the code to get a rough idea of how the Assembly stores variables in memory space. - Type
maketo compile the program to executableadd. Start debugging withgdb ./add. Set break points in the following places:
There are questions you need to answer on the Question Sheet for EACH of the break points below. Please complete all questions for a break point before running to the next break point in GDB.
- Right before calling
addfunction inmain: Line 12 - The beginning of
add: Line 4 - The end of
add: Line 7
- Right before calling
Run the code and answer the questions on the Question Sheet in Part3.
Part 4: Stack/Procedure Call: Function Return
The goal of this part of the lab is to discover how a function returns to where it was called after finishing running the function.
cdinto thelab3/part4directory.- Open the
simple.cfile usingvim. Skim through the code to get a basic idea of the functions. - Pay attention to callers and callees of different functions, i.e., which function(s) is called by which function(s).
- Type
make simple.sto generate the Assembly code. Open thesimple.sfile usingvim. Skim through the code to get a rough idea of how the Assembly stores variables in memory space. - Type
maketo compile the program to executablesimple. Start debugging withgdb ./simple. Set break points in the following places:
There are questions you need to answer on the Question Sheet for EACH of the break points below. Please complete all questions for a break point before running to the next break point in GDB.
- Right before calling the
addfunction inmain: Line 17 - At the beginning of the
addfunction: Line 8 - Right before calling the
do_nothingfunction inadd: Line 10 - At the beginning of the
do_nothingfunction: Line 4 - At the end of the
do_nothingfunction: Line 5
- Right before calling the
Run the code and answer the questions on the Question Sheet in Part4.
Finishing the Lab
- Scan and Upload the signed Question Sheet to Gradescope.