-
Write a program,
funcPlot.py, that implements the following design:- Prompt the user for a file name
- Open a file with the given name
- Display a graphics window with width 720 and height 400.
- Read each line from the file. For each line, plot a point on the graphics window. You should assume the lines have the format specified in funcDump (treat the first number as the x coordinate and the second number as the y).
- Close the file
-
Test your program using your
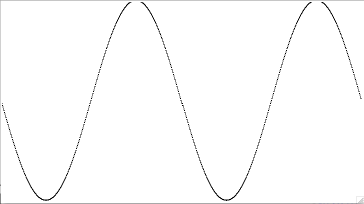
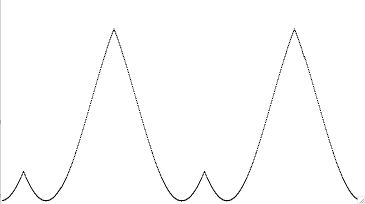
cos.txtoutput from funcDump. (Note: you must placecos.txtin the same folder asfuncPlot.pyto read it.) You may also test using the sample outputs for different functions below. (The functions are "upside down" because of the graphics coordinate system. You could fix that by using zellegraphics' win.setCoords() method if you so desired, but we won't require it.) - Submit your Python source file to the funcPlot Drop Box in the Homework 6 folder on ANGEL.
(40 points) Photo slideshow. (Note: we suggest that you do the funcPlot problem above BEFORE the SlideShow problem. Doing so will help you through some of the file reading issues that may otherwise hang you up in SlideShow.) These days, many people use their computer as a "digital shoebox" of photographs. You will write a program to present a slideshow of a number of photos, in an order that you specify in a text file.
-
Write a program,
slideshow.py, that implements the following design:- Prompt the user for the name of a runlist, a file that contains a list of image file names
- Open the runlist.
- Read the next image file name from the runlist file, one at a time, and
display the corresponding image in a graphics window.
When the user clicks in the window, the slideshow advances
to the next image.
Notes and Hints:
- An Image is an object just like a Rectangle or a Circle. You can find help for how to use it in the ZelleGraphics help pdf file you got on day 1 when you installed zellegraphics.py.
- Slideshow should display no more than one image at any given time. An image should be displayed as long as there are image file names yet to be read from the input file. When the user clicks on the last image, the program will end.
- If you draw a small image on top of a large one,
you can see both, which looks messy. However, in Zelle
Graphics, you can tell the window to undraw any object; for
example, to undraw an image called
photo, usephoto.undraw() -
You will need to strip off the newline character from
each line you read in.
Use the string class' strip() function to do this
(import string and see
help string.strip()for details). Unfortunately, slicing with a negative index (myList[:-1]) doesn't work on Windows like you might expect.
- Close the file.
- Test your program.
- We have given you a zip file with 4 photos. We have also given you 3 files containing lists of those photos in various combinations: runlist0.txt has a single photo, runlist1.txt lists 3 other photos, and runlist2.txt has all 4 photos in a different order and with one repeated. Unzip the images and files to the same folder as slideshow.py is in. Run your program with each of these 3 runlists.
- Optional: Have some fun creating a slideshow of your own photographs. Notes: The textbook says "most platforms will support JPG, GIF, and BMP files."; unfortunately, it appears that JPG files don't work in Windows. So gather images of the other format or convert them to GIF using Paint or some other program.
-
Submit
slideshow.pyto the Slideshow Drop Box in the Homework 6 folder on ANGEL.
(5 points) Challenge Problem: This problem is not required, but is an interesting extension that you might like to try.
- Create a version of funcPlot.py that rather than just plotting points, draws lines between consecutive points.