Chapter 5: Waves Experiments
Resonances in Strings
References
Crummett and Western, Physics: Models and Applications,
Sec. 15-2,5
Halliday, Resnick, and Walker, Fundamentals of Physics (5th
ed.), Sec. 17-3 to 6
Tipler, Physics for Scientists and Engineers (3rd ed.), Sec.
13-6
Introduction
 Any mechanical
system has certain characteristic modes of vibration, each mode with a
particular characteristic frequency. If the system is made to vibrate by
driving it with an external source, it will respond strongly only when
the source frequency is equal to, or near, one of these characteristic
frequencies. This phenomenon is known as resonance. The characteristic
resonance frequencies of a one-dimensional vibrating system are in simple
whole-number ratios; they form what is known as a harmonic series.
In this experiment, you will observe and measure the harmonic frequencies
of a simple one-dimensional system: a stretched string. (It's interesting
to note that a large number of musical instruments are based on this system.)
Any mechanical
system has certain characteristic modes of vibration, each mode with a
particular characteristic frequency. If the system is made to vibrate by
driving it with an external source, it will respond strongly only when
the source frequency is equal to, or near, one of these characteristic
frequencies. This phenomenon is known as resonance. The characteristic
resonance frequencies of a one-dimensional vibrating system are in simple
whole-number ratios; they form what is known as a harmonic series.
In this experiment, you will observe and measure the harmonic frequencies
of a simple one-dimensional system: a stretched string. (It's interesting
to note that a large number of musical instruments are based on this system.)
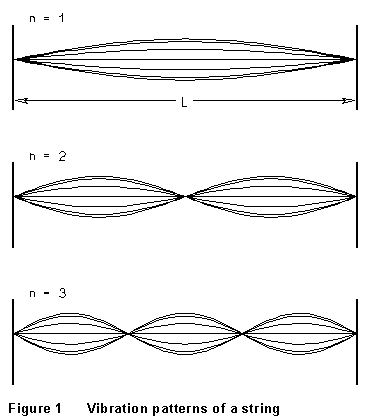
If a string is stretched between fixed end points, large-amplitude vibrations
of the string can only occur with a frequency such that a whole
number of half wavelengths will fit between the ends. The possible
vibration patterns are therefore like those sketched in Figure 1, and the
corresponding frequencies are given by
 for n
= 1, 2, 3, . . . (1)
for n
= 1, 2, 3, . . . (1)
where
 (2)
(2)
is the speed of traveling waves on the string. In (2), T is the tension
in the string and µ its mass per unit length.
The experimental arrangement is sketched in Figure 2. The resonating
system is driven by a loudspeaker connected to a variable-frequency oscillator,
so that the driving frequency can be varied at will. For the vibrating
string, your eye is all the "resonance detector" you need. The
pulley-and-weight arrangement in Fig. 2 allows one to vary the tension
in the string.
Equipment
- string support with loudspeaker driver and pulley
- weights and hanger
- meter stick
- vernier calipers
- support hardware
- Wavetek-180 (or 180LF) oscillator with frequency fine-adjust
- Hewlett-Packard 5314A frequency meter
A NOTE ON THE APPARATUS: The HP 5314A Frequency counter-timers will
give either frequency (cycles/sec or Hz) or period (sec) information, averaging
over 1, 10, or 100 samples of the input signal. They read unpredictably
if the input signal is too big, but this can be fixed by pushing the X20
attenuator button. At high frequencies (106 Hz or more), the period readings
become inaccurate; below about 100 Hz, the frequency readings are inaccurate.
If the "overflow" light comes on, it indicates that one or more
of the most significant digits are being lost from the display; try another
setting. On the Wavetek signal generators, make sure the "frequency
sweep" and "DC offset" features are turned off; you want
a steady signal frequency.
Procedure A. Stretched String
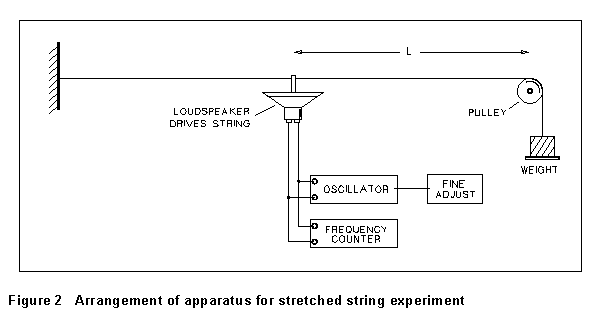
(1) Fasten one end of a string to the support and run the string
over the pulley at the other end. Fasten a weight hanger to the free end
of the string as in Figure 2. You may want to add some extra weight to
the hanger to increase the total mass, which determines the tension in
the string; consult your instructor. Connect the HI output of the oscillator
to the loudspeaker and the LO output to the A input of the HP frequency
counter. Connect the frequency fine-adjust box to the VCG input of the
oscillator.
(2) Pass the string through the slot cut in the small rod that
extends from the speaker cone. Measure the length of string from the
speaker rod to the point at which the string touches the pulley.
Repeat this measurement several times.
(3) Turn on the oscillator and, starting at a frequency around
10 Hz, increase its frequency slowly until the section of string between
the loudspeaker and the pulley is vibrating in its fundamental mode (as
in Fig. 1a) with maximum amplitude. The fine-control box may help
you get precisely on the resonance frequency. (It increments the oscillator
frequency by an amount up to about .08 of the FREQ MULT control.) NOTE:
here and in the next two steps, you should use as low an oscillator
signal amplitude as you can, and still locate the resonance frequency clearly.)
Record the oscillator period as read by the HP-5314A. (This will be more
accurate than recording the frequency reading. See the note above.)
(4) Turn the oscillator frequency up until the string vibrates
in its second mode, and record the oscillator period. Continue in
this way until you have measured as many of the modes as you can clearly
discern. You should be able to measure at least through f4.
(You will probably have to increase the driving signal amplitude as you
go to the higher frequencies.)
(5) Exchange roles with your lab partner and repeat steps (3)
and (4), so that you have two independent determinations of each resonance
frequency.
(6) Your lab instructor will supply you with some appropriate
pre-measured lengths of the same string. Weigh these on the chain balance,
and calculate the mass per unit length of the string (µ), with error
estimate. (Note: In doing this, you won't have to add any weights
to the balance pan. The slider and chain provide enough weight to measure
a meter or so of string.)
Analysis
(1) Tabulate your observed values of the resonance frequencies
of the string. For each mode of vibration, show the individual determinations
of fn, their average value, and the corresponding value
of f1 = fn/n. Find the mean
and standard error of the values of fn. Are your data
consistent with the expected behavior fn = nf1,
within experimental error?
(2) Use your overall mean value of f1 in Equation
(1) to find the wave velocity on the string, and find the error in this
determination. Calculate the expected value of v from Equation (2),
and find the error in this determination. Are your expected and observed
values of v consistent with each other?
Chapter 5 -- Waves Experiments --
Prism Spectrometer -- Dispersion Curve for Glass (Version 1)
last update 7/97