 (5)
(5) | Table of Contents |
Carrying out Equation (2) for a large number of measurements is kind of tedious (unless it's built into your calculator). There are a couple of ways to estimate s with a little less effort.
What we want is a measure of the typical size of a deviation from the mean. Now just averaging the deviations won't tell us anything, because the definition of the mean is such that the algebraic sum of the deviations from it is always zero. But we could calculate the average absolute deviation:
 (5)
(5)
This is maybe a little easier to figure than s, and looks like it ought to measure more or less the same thing. For "normally distributed" data (more about what that means later), with "several" repetitions, is about /1.3. For instance, suppose you repeat some time measurement five times, getting
1.64 1.50 1.65 1.53 1.71 sec
For these data, = 0.073 sec, from which we estimate t = (1.3)(0.073) = 0.095 sec. Using Equation (1) to get t directly, on the other hand, gives .088 sec for these data. Calculating the standard deviation from just a few trials of an experiment is, itself, a fairly sloppy procedure, and in this case the estimate is about as good as the calculation.
 Another convenient
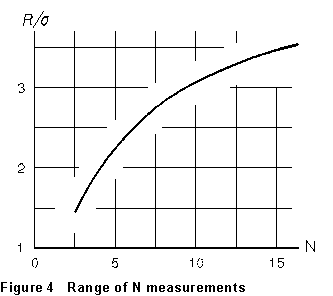
estimator is the range R spanned by the data -- that is, the difference
between the largest and smallest of the N values. For normally distributed
data, we can calculate the expected range R of N trials of
an experiment; the results, expected range measured in standard deviations,
are graphed in Figure 4. But one can just look at a list of values and
get the range, and then use the graph to estimate from the
range. For the time data above, N = 5 and R = 1.71 - 1.50
= 0.21 sec. From the graph, R = 2.3 for N = 5, so we estimate

-- again, compared to the calculated .088 sec. We can make this estimator even simpler if we notice from Figure 4 that, for N from about 3 to about 11 or 12, R/ is very nearly equal to the square root of N. This gives us the following very handy "rule of thumb":
for N not very large,  (6a)
(6a)
and therefore  (6b)
(6b)
using which, with a little practice, we can estimate the standard deviation and the standard error of a data set pretty well just by looking at it.