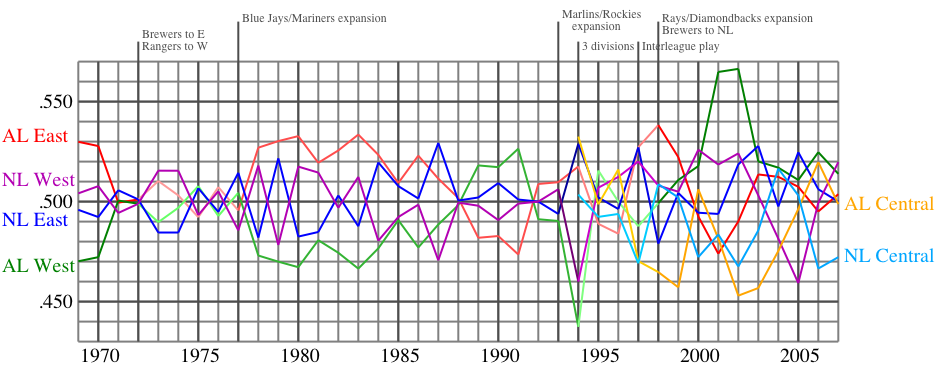
Won-lost record of divisions
Once the leagues split into divisions, the possibility of a talent
imbalance arose. Both American League expansion teams were put in the
AL West, so the AL East started as the stronger division. The rapid
rise of the Royals followed by the Brewers; move to the East kept the
divisions fairly equal for a few years. An imbalance appeared in the
late 70s when the Yankees and Brewers joined the Orioles and Red Sox as
strong teams in the AL East. When the Brewers, Orioles, and Yankees
faded in the late 80s, and LaRussa's A's rose, the AL West moved on top
for a few years. The split into three smaller divisions made wider
swings plausible. The largest came as the Mariners and A's put together
some outstanding seasons, with the Mariner winning 116 in 2001 and the
A's putting together consecutive 100+ win seasons. They were joined by
the 99 win Angels in 2002. YEAR ALEast ALWest ALCent NLEast NLWest NLCent Notes
1969 .530 .470 .496 .504 Start of divisional play
1970 .528 .472 .492 .508
1971 .499 .501 .506 .494
1972 .501 .499 .501 .499 Brewers to E, Rangers to W
1973 .510 .490 .485 .515
1974 .503 .497 .485 .515
1975 .492 .508 .507 .493
1976 .507 .493 .495 .505
1977 .496 .504 .514 .486 Blue Jays(E) and Mariners(W) added
1978 .527 .473 .482 .518
1979 .530 .470 .522 .478
1980 .533 .467 .483 .517
1981 .519 .481 .485 .515
1982 .526 .474 .503 .497
1983 .534 .466 .488 .512
1984 .523 .477 .520 .480
1985 .509 .491 .508 .492
1986 .523 .477 .502 .498
1987 .511 .489 .529 .471
1988 .502 .498 .501 .499
1989 .482 .518 .502 .498
1990 .483 .517 .509 .491
1991 .474 .526 .501 .499
1992 .509 .491 .500 .500
1993 .510 .490 .494 .506 Marlins(E) and Rockies(W) added
1994 .518 .437 .533 .529 .460 .504 split to three divisions
1995 .489 .516 .499 .502 .507 .492
1996 .484 .500 .516 .496 .512 .494
1997 .527 .488 .470 .527 .520 .469 Interleague play begins
1998 .538 .499 .465 .479 .508 .509 Devil Rays(E) and Diamondbacks(W) added, Brewers to NLC
1999 .522 .511 .457 .504 .505 .502
2000 .493 .518 .472 .494 .526 .472
2001 .474 .565 .481 .494 .519 .484
2002 .490 .566 .453 .519 .524 .468
2003 .514 .520 .457 .528 .504 .486
2004 .512 .517 .475 .498 .481 .516
2005 .507 .511 .496 .525 .459 .504
2006 .495 .525 .520 .506 .499 .467
2007 .504 .514 .499 .500 .520 .472
2008 .538 .487 .501 .490 .463 .515
2009 .520 .531 .470 .488 .519 .482
2010 .532 .481 .493 .514 .506 .475
2011 .528 .498 .479 .519 .502 .477
2012 .519 .542 .468 .514 .495 .476
2013 .533 .483 .494 .483 .493 .520 Astros to ALE, all divisions have five teams
2014 .507 .506 .502 .499 .480 .505
2015 .517 .498 .506 .462 .490 .527
2016 .520 .504 .493 .495 .481 .505
2017 .512 .509 .498 .472 .517 .499
2018 .516 .538 .436 .485 .498 .528
2019 .499 .521 .460 .511 .505 .504
2020 .513 .467 .520 .487 .533 .480
2021 .527 .504 .490 .468 .517 .494
2022 .541 .490 .472 .510 .522 .465
ALEast ALWest ALCent NLEast NLWest NLCent
Interleague play
The advent of interleague play allows us to take a look at the performance of each league against the other.
                               AL parks     NL parks
Year ALwins  NLwins  ALpct      AL-NL        AL-NL
1997    97     117    .453    59-48 .551    38-69 .355
1998   114     110    .509    56-56 .500    58-54 .518
1999   116     135    .462    61-65 .484    55-70 .440
2000   136     115    .541    76-49 .608    60-66 .476
2001   132     120    .524    75-51 .595    57-69 .452
2002   123     129    .488    64-62 .508    59-67 .468
2003   115     137    .456    62-64 .492    53-73 .421
2004   127     125    .504    76-50 .603    51-75 .405
2005   136     116    .540    82-44 .651    54-72 .429
2006   154      98    .611    86-40 .683    68-58 .540
2007   137     115    .544    72-54 .571    65-61 .516
2008   149     103    .591    79-47 .627    70-56 .556
In AL parks the AL is 848-630 .574.
In NL parks the NL is 790-688 .535.
The difference in the Home vs. Road WL-pct. is .108.
In AL vs. AL games the home team was 6521-5637 .536, a home-field advantage of .073.
In NL vs. NL games the home team was 7500-6405 .539, a home-field advantage of .079.
AL teams runs per game Home vs. AL Road AL parks Home vs. NL Road NL parks
Year G RPG ORPG WL G RPG ORPG WL G RPG ORPG WL G RPG ORPG WL
1997 1025 4.95 4.97 .513 1025 4.97 4.95 .487 107 5.04 4.66 .551 107 4.25 4.75 .355
1998 1022 5.03 5.03 .529 1022 5.03 5.03 .471 112 5.08 5.09 .500 112 4.64 4.53 .518
1999 1007 5.18 5.22 .517 1022 5.22 5.18 .483 126 5.19 5.74 .484 125 4.74 5.21 .440
2000 1007 5.38 5.27 .528 1007 5.27 5.38 .472 125 5.54 4.97 .608 126 4.65 4.86 .476
2001 1007 4.87 4.90 .520 1007 4.90 4.87 .480 126 5.10 4.67 .595 126 4.22 4.65 .452
2002 1006 4.90 4.80 .541 1006 4.80 4.90 .459 126 4.88 4.60 .508 126 4.06 4.10 .468
2003 1009 4.91 4.79 .549 1009 4.79 4.91 .451 126 4.75 4.98 .492 126 5.08 5.07 .421
2004 1007 5.03 5.01 .547 1007 5.01 5.03 .453 126 5.28 4.83 .603 126 4.66 4.78 .595
2005 1008 4.79 4.70 .525 1008 4.70 4.79 .475 126 5.02 3.67 .651 126 4.75 4.71 .429
2006 1008 5.05 4.80 .543 1008 4.80 5.05 .457 126 5.36 4.00 .683 126 5.25 4.85 .540
2007 1008 4.88 4.80 .548 1008 4.80 4.88 .452 126 5.67 4.76 .571 126 5.06 4.54 .516
2008 1008 4.98 4.54 .560 1008 4.54 4.98 .440 126 5.09 4.25 .627 126 4.83 3.80 .556
Rate 4.9955 4.9029 4.9029 4.9955 5.1678 4.6813 4.6881 4.6543
Total 12122 60556 59433 1478 7638 6919 1478 6929 6879
NL runs per game
         Home vs. NL         Road NL parks       Home vs. AL       Road AL parks
Year   G   RPG ORPG  WL    G   RPG ORPG  WL    G   RPG ORPG  WL   G   RPG ORPG  WL
1997 1027 4.67 4.51 .544 1027 4.51 4.67 .456  107 4.75 4.25 .645 107 4.66 5.04 .449
1998 1186 4.72 4.43 .554 1186 4.43 4.72 .446  112 4.54 4.64 .482 112 5.09 5.08 .500
1999 1170 4.97 4.94 .524 1170 4.94 4.97 .476  125 5.21 4.74 .560 126 5.74 5.19 .516
2000 1171 5.10 4.93 .545 1171 4.93 5.10 .455  126 4.86 4.65 .524 125 4.97 5.54 .392
2001 1170 4.70 4.71 .518 1170 4.71 4.70 .482  126 4.65 4.22 .548 126 4.67 5.10 .405
2002 1168 4.58 4.34 .548 1168 4.34 4.58 .452  126 4.10 4.06 .532 126 4.60 4.88 .492
2003 1169 4.68 4.46 .553 1169 4.46 4.68 .447  126 5.07 5.08 .579 126 4.98 4.75 .508
2004 1169 4.62 4.63 .511 1169 4.63 4.62 .489  126 4.78 4.66 .405 126 4.83 5.28 .397
2005 1171 4.52 4.43 .532 1171 4.43 4.52 .468  126 4.71 4.75 .571 126 3.67 5.02 .349
2006 1169 4.85 4.75 .544 1169 4.75 4.85 .456  126 4.85 5.25 .460 126 4.00 5.36 .317
2007 1171 4.79 4.64 .541 1171 4.64 4.79 .459  126 4.54 5.06 .484 126 4.76 5.67 .429
2008 1168 4.67 4.52 .558 1168 4.52 4.67 .442  126 3.80 4.83 .444 126 4.25 5.09 .373
Rate     4.7400 4.6066       4.6066 4.7400       4.6543 4.6881      4.6813 5.1678
Total 13909  65929 64073                      1478 6879 6929     1478 6919 7638
A comparison of scoring using Road RPG - Home RPG
     ALvAL  ALvNL   NLvNL  NLvAL
1997 +0.02  -0.79   -0.16  -0.08
1998 +0.00  -0.44   -0.30  +0.55
1999 +0.04  -0.45   -0.03  +0.53
2000 -0.11  -0.89   -0.17  +0.11
2001 +0.04  -0.88   +0.00  +0.02
2002 -0.10  -0.82   -0.24  +0.50
2003 -0.12  +0.23   -0.22  -0.09
2004 -0.02  -0.62   +0.01  +0.05
2005 -0.09  -0.27   +0.09  -1.04
2006 -0.25  -0.11   +0.11  -0.85
2007 -0.08  -0.60   -0.15  +0.22
2008 -0.44  -0.26   +0.15  +0.44
Tot  -0.09  -0.48   -0.13  +0.03
AL teams seem to gain about .4 runs par game from using the DH while NL
teams gain only about .16. I don't think that NL pitchers produce .25
RPG, so this suggests that the difference is that the AL teams are able
to benefit much more from the DH than the NL teams are. It makes sense
that the NL teams wouldn't find it worthwhile to pay that much for a
player who'd only make a difference in roughly 10% of the games, but a
more detailed look is probably warranted.
The next thing to do is to look at DH and pitcher batting.
Someday.