Advanced Laboratory and/or Lecture Demonstration Apparatus
Apparatus Title: -- Quantitative Desktop Doppler Shift Demonstration with An Inkjet Printer
Abstract - While circular-motion demonstrations of Doppler shifts are compact and create audible shifts, the frequency is constantly changing. We exploit the constant velocity of the printing mechanism of an inkjet printer to produce distinct shifted frequency peaks for quantitative comparison with the theory, using a PC with soundcard for data analysis.
Demonstration and Analysis of Doppler Frequency Shifts Using an Ink Jet Printer
Many demonstrations exist for illustrating the effects of Doppler shifts that produce audible shifts. Among popular types of Doppler shift demonstrations many incorporate circular motion. These demonstrations can be quite nice in that they produce noticeable shifts, convincing students that the phenomena really exists, however, since from the point of view of the "observer" the source's velocity is constantly changing, there are no distinct frequencies which can be easily measured for quantitative experiments. Therefore, circular motion demonstrations of Doppler shifts have limited, however useful, utility.
A linear motion demonstration would be a better approach, however, the need for relatively high velocity to create noticeable shifts limits the venue in which they can be used to large classrooms, lecture halls or parking lots. Of course, this limit applies only for creating audible shifts; theoretically a Doppler frequency shift is created by any motion and with sensitive instruments could be measured. Therefore, we chose to aim for a small-scale apparatus (less than a meter in length) that could create measurable frequency shifts that are reproducible and reliable, at the expense of clearly audible shifts. Our solution is, then, to combine the best part of the circular motion apparatuses, sustained length of the experiment, with the best aspect of the linear motion demonstration, constant frequency shifts. This requires a device that reverses direction while maintaining constant velocity.
A device with a sound source mounted on some form of carriage that travels a short distant at constant velocity then reverses direction with little loss in the velocity's magnitude was needed. With a receiver placed at one end in the line of motion to record the sound, these cycles could be repeated to collect enough data to use a Fast Fourier Transform for analysis. It was assumed that three distinct frequencies would be determined; the natural frequency of the source, one for the trips away and one for the trips back, the two in motion being oppositely separated from the natural frequency.
After consideration of many possible devices we realized that they already existed. We exploited the stepper motor carriage drive of the common ink jet printer. A speaker, driven by function generator software, was attached to the carriage and a microphone was placed at one end and connected to the computer to record the frequencies. We created a "document" to print with a vertical line at each edge so the printer would simply go from side to side to draw equal numbers of dots, without slowing down to type any letters along the way. When a constant frequency is broadcast through the speaker and the "print job" is sent to the printer, The three frequency peaks appear on the FFT graph, as predicted.
A Hewlett Packard 500 Series Desk Jet Printer provides the carriage on which our demonstration operates. The source and observer can be reversed to prove the symmetry of the theory. The sound was generated and the output was analyzed using software developed in house and available free at http://duncan.rutgers.edu/physicsfreewares.htm. (fftscope) To determine the velocity of the carriage we used a photo gate timer. With only a small speaker and a standard computer microphone this experiment can be done with any PC computer and ink jet printer. It would be suitable for a lecture demonstration or a qualitative lab.
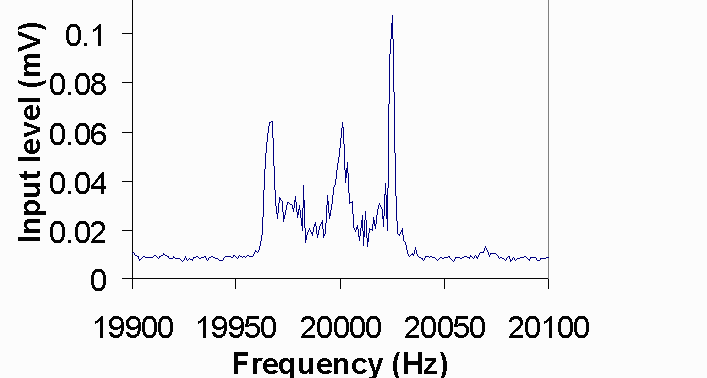
It is important to determine the relative scales of time and frequency. The FFT software should take data at least longer than dt1 + dt2, the period of the motion of the ink carriage. The shifted frequency peak has a width proportional to 1/dt1 and 1/dt2, corresponding to each direction. They are composed of Fourier series frequencies that are integer multiples of 1/dt1 and 1/dt2. The frequency used must be high enough to separate the shifted peaks. In our case, 10-20 KHz works well. We use separate sound cards for input and output to reject cross talk between output and input signals. Data is averaged over several cycles to improve the signal/noise ratio. Fig. 1 shows typical data from our setup. We measured the speed of the ink carriage to be V1 (approaching)=0.426 cm/s and V2 (departing)=0.616 cm/s. The shifted frequency peaks agree well with the theory easily (~ 3%), as shown in Table 1, using 346m/s as the speed of sound.

Fig.1 Distinctly resolved Doppler-shifted peaks from a 20KHz sound source.

Table 1. Comparison between theoretical and measured frequencies.