- As you read, see if you can answer the self-check questions.
- Bring your questions to class!
-
In Eclipse, checkout the Decisions project.
- Use the
SVN Repositoriesview to check out this project.
- Use the
- (16 points) Complete Exercise P5.4 from Big Java. (This is P5.5 in ed3.) We’ve provided a commented-out
GradeTestJUnit test class for you. Uncomment and study the code there for clarification of the design of theGradeclass. - (38 points, 41 possible if you do the extra credit) Create a class
CubicPlot. Its constructor should take eight (yes, eight!) arguments:- top, left — the top-left coordinates for a rectangle on which the class will plot
- width, height — the width and height of the rectangle on which the class will plot
- a, b, c, d — the coefficients of the equation y = ax3 + bx2 + cx + d, that the class will plot
The class should include a method
drawOn(Graphics2D g)that plots the graph as detailed below. The classesCubicPlotViewerandPlotComponentare provided.PlotComponentincludes a call ofCubicPlot’s constructor that we supplied to test your code. Uncomment that call.Implement the
CubicPlotclass to satisfy these conditions:- The origin of the plotted graph should be in the center of the rectangle described by
top,left,width, andheight. - The plotted graph should display x- and y-axes. You do not need to include tick marks on the axes.
- Use
String’sformat()method andGraphics2D’sdrawString()method to display the equation on the graph. - Use a loop to calculate the y value for each integer x from
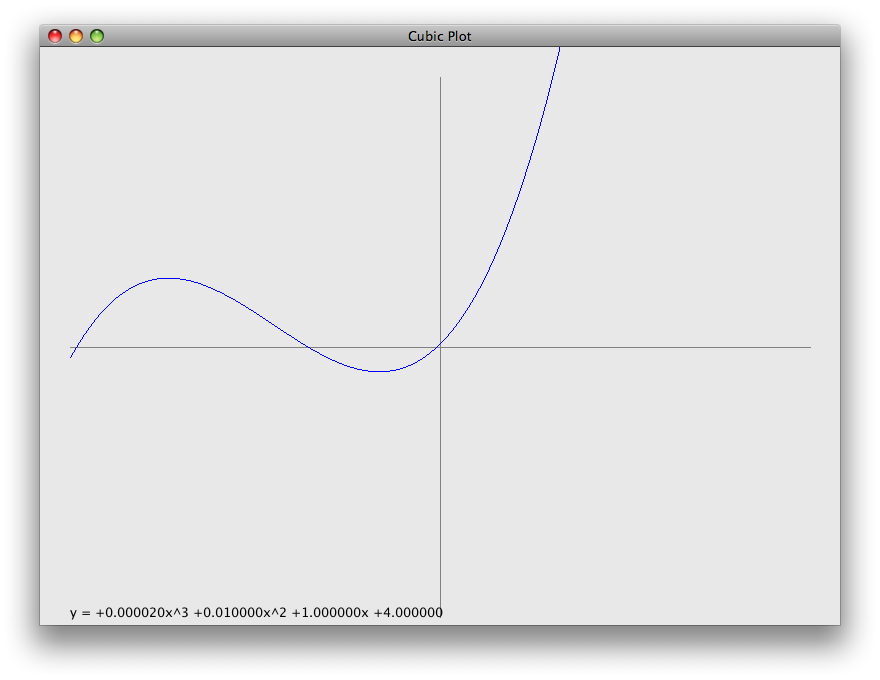
-width/2towidth/2. Plot the graph by drawing a short line from the previous point calculated to the next point. (You’ll have to calculate the first point outside the loop.) Be sure to shift your plot according to the required origin. You should also “flip” the y values when plotting so that the y-axis increases up the screen. - Bonus: clip the plot so that it doesn’t extend beyond the bounds given by
top,left,width, andheight.
The figure below gives an example plot (without clipping, no bonus for me):