-
Your programming work for this assignment must be done in the
FundamentalDataTypesproject inside Eclipse. Use theSVN Repository Exploringperspective to check out this project, then switch back to theJavaperspective. -
Add a
bigFact()method to theLargeFactsclass so that it usesBigIntegers. See theTODOcomments in the file for details. -
Using a
forloop and thecharAt()method ofString, complete the fourTODOitems in theStringsAndCharsclass. -
Edit the
main()method ofScannerExampleto print appropriate prompts for the user. -
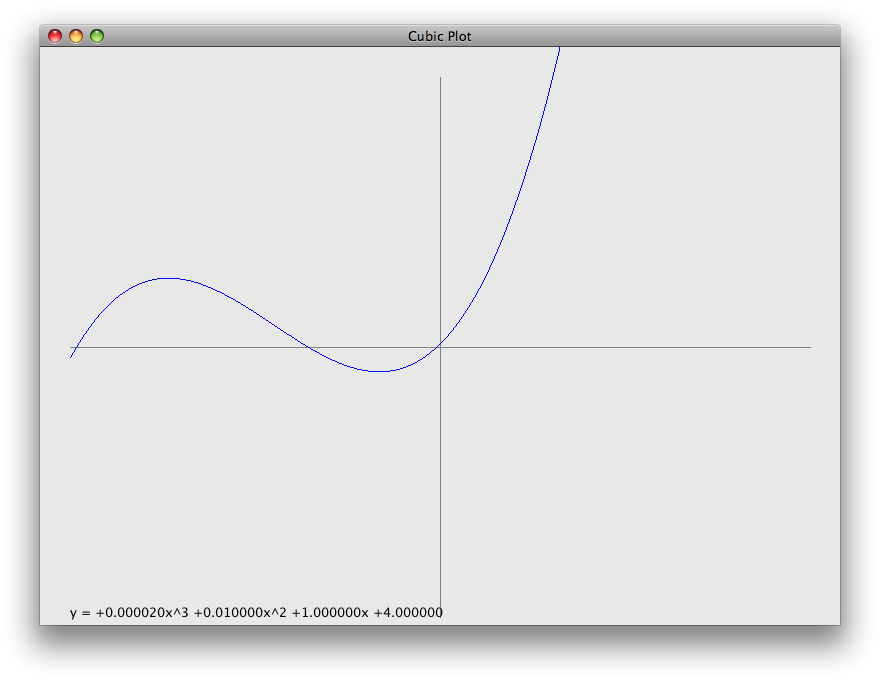
Create a class
CubicPlot. Its constructor should take eight (yes, eight!) arguments:- top, left — the top-left coordinates for a rectangle on which the class will plot
- width, height — the width and height of the rectangle on which the class will plot
- a, b, c, d — the coefficients of the equation y = ax3 + bx2 + cx + d, that the class will plot
drawOn(Graphics2D g)that plots the graph as detailed below. The classesCubicPlotViewerandPlotComponentare provided. InPlotComponent, uncomment the call theCubicPlot’s constructor before beginning.-
The origin of the plotted graph should be in the center of the rectangle described by
top,left,width, andheight. - The plotted graph should display x- and y-axes. You do not need to include tick marks on the axes.
-
Use
String’sformat()method andGraphics2D’sdrawString()method to display the equation on the graph. -
Edit
PlotComponentso that the coefficient values are read using aScannerinstead of being hardcoded. -
Begin this now, but finish this step for HW 7: Use a loop to calculate the y value for each integer x from
-widthtowidth. Plot the graph by drawing a line from the previous point calculated to the next point. (You’ll have to calculate the first point outside the loop.) Be sure to shift your plot according to the required origin. You should also “flip” the y values when plotting so that the y-axis increases up the screen. -
Bonus: clip the plot so that it doesn’t extend beyond the bounds given by
top,left,width, andheight.