-
Your programming work for this assignment must be done in the
TypesAndDecisionsproject which you should check out from your SVN repository into Eclipse. -
(2)
Add to the
LargeFactsclass abigFact()method that usesBigIntegers. See theTODOcomments in the file for details. -
(2)
Using a
forloop and thecharAt()method ofString, complete the fourTODOitems in theStringsAndCharsclass. -
(1)
Edit the
main()method ofScannerExampleto print appropriate prompts for the user. -
(15)
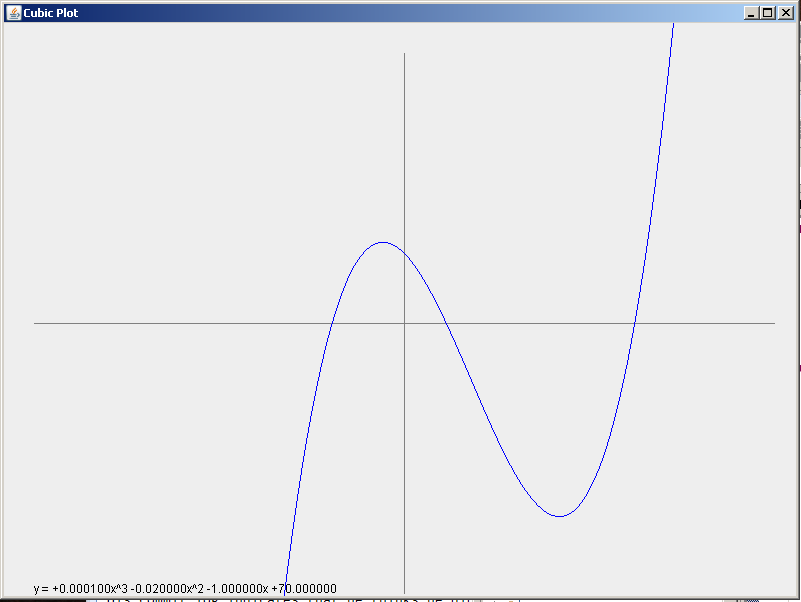
Create a class
CubicPlot. Its constructor should take eight (yes, eight!) arguments:- top, left — the top-left coordinates for a rectangle on which the CubicPlot object will draw the plot.
- width, height — the width and height of the rectangle on which the the CubicPlot object will draw the plot.
- a, b, c, d — the coefficients of the equation y = ax3 + bx2 + cx + d, that the class will plot
drawOn(Graphics2D g)that plots the graph as detailed below. The classesCubicPlotViewerandPlotComponentare provided. InPlotComponent, uncomment the call theCubicPlot’s constructor before beginning.- One pixel on the screen represents one x or y unit in the graphing coordinate system. A more sophisticated system would allow the user to specify scale factors in the x and y directions, but you do not have to do that.
-
The origin of the plotted graph should be in the
center
of the rectangle described by
top,left,width, andheight. - The plotted graph should display x- and y-axes. You do not need to include tick marks on the axes.
-
Use
String’sformat()method andGraphics2D’sdrawString()method to display the equation on the graph. -
Use a loop to calculate the
y
value for each integer
x
from
-width/2towidth/2. Plot the graph by drawing a line from the previous point calculated to the next point. (You’ll have to calculate the first point before the loop.) Be sure to shift your plot according to the required origin. You should also “flip” the y values when plotting so that the y-axis increases up the screen. - Test your code with several different sets of values for a, b, c, and d. You might want to plot the same functions in Maple (forcing the x- and y-ranges of Maple's plots to be the same as in your Java window) for comparison purposes.
- Edit the code so that the
coefficient values are read from user input using a
Scannerobject instead of being hardcoded. -
Bonus:
(3)
clip the plot so that it doesn’t extend beyond the bounds
of the rectangle given by
top,left,width, andheight.
PlotComponent.java.